


In today’s modern reporting landscape, there is an expectation of the business users we serve: Self-service of any and all information, for whatever time period, efficiently and in real-time. Now, as we (the builders of business intelligence solutions) know, this is a high bar to achieve.
In a recent Power BI blog post, I outlined performance tuning tips to speed up the data refresh time on reports. In this blog post, I will focus on an aging report solution that allows users to input a date and completely change the output of the dataset in a short amount of time without a full data refresh.
Business Requirements
While building a Power BI data model for a client, I received a request to create a report that allows users to age their accounts payables/receivables based on a user-selected date. The report needed to show the outstanding dollar value bucketed in different date ranges based on this date. Using the report, the business could compare the values in these buckets over different periods of time. For example, they could compare what the dollar value of accounts receivable 61-90 days outstanding was two months ago versus last month to gauge their improvements on collection and forecast what their accounts receivables outstanding next month might be.
The report had to work in the Power BI Service for a non-technical user without creator privileges. Because of these reasons, passing report parameters into the report via URL modification and adjusting the value in the parameter settings were not viable options. We needed a way for the user to input a date on the report screen and have the values shown update based on that value.
Technical Prerequisites
The data resides in a transactional table called ‘Fact_Vendor Ledger Entry’. This table has one entry per monetary adjustment to their financial ledgers. There is a field on this table, [Posting Date], that indicates when a record was added to the database and [Document Date] that indicates how long outstanding the payable/receivable is and will be the date to age against in the report.
Assumptions
In this blog post, several assumptions are made regarding the readers’ Power BI experience and as a result the following elements will not be covered:
Creating relationships, calculated columns, measures, and visuals
‘And’ and ‘Or’ logical operators
Basic DAX commands
Technical Requirements
Users need to see the aging of their accounts payables/receivables as of a certain date. This date will be selected in Power BI and will be called [As-Of Date]. Filtering on this date will remove any rows where any of the following conditions are met:
[Posting Date] >= [As-Of Date] – The record had not yet been posted by this date.
[Closed at Date] < [As-Of Date] and [Closed at Date]!= 1900/01/01 – Any rows that were closed before the As-Of date will also be filtered (A Closed at Date value of 1900/01/01 indicates that the account is still open).
The data will then be bucketed into 30-day increments, where the bucket range is based on the [Document Date]. In our case, we will have buckets of 1-30, 31-60, 61-90, and 91+ days.
Solution
1 – Create Two Date Tables
Create two date tables in DAX—one for our Document Dates, and the other for our Posting Dates. They can be named anything and can have as few or as many columns to satisfy reporting requirements. For this example, we will create a basic calendar using Power BI’s CALENDAR function. The exact usage of these tables will be detailed in subsequent steps.


2 – Join to Our Date Tables
Create a single directional relationship from the [Posting Date] on the Fact Vendor Ledger Entry table to the ‘Posting Dates’[Date] field as well as from the [Document Date] on the Fact Vendor Ledger Entry table to the ‘Document Dates’[Date] field.
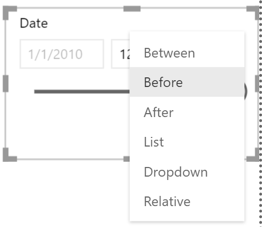
3 – Create “As-Of Date” Slicer
Use ‘Posting Dates’[Date] to create an “As-Of Date” slicer that will filter out the dataset based on the date selected. We will select the option of ‘Before’, so the user is only allowed to select one date. The date selected will be referenced as MAX(‘Posting Dates’[Date]) in the created measure.
4 – Create Measures
Create measures on ‘Fact_Vendor Ledger Entry’ for each of our aging buckets. The code below is for the 31-60 Day Aging Bucket. All buckets will need their own specific measure.
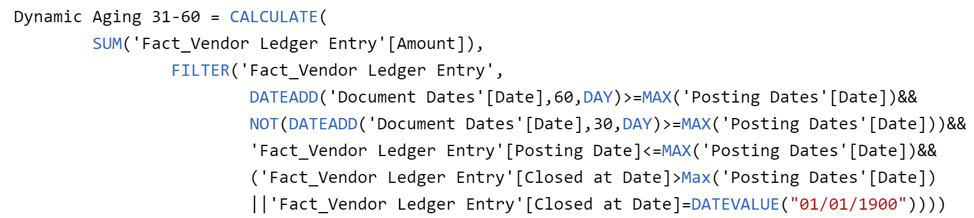
This formula says to take the sum of [Amount], when our [Posting Date] is within 60 days of the [As-Of Date] and not within 30 days of the [As-Of Date]. Additionally, the [Closed at Date] must be after the [As-Of Date], which indicates that the entry has not been closed, or is equal to 01/01/1900, which is the database’s method of indicating that the entry is still open.
When added to a table, these measures will filter values based on the date selected by the user.
A few notes about the DAX expression:
Due to the output of DATEADD, a date table is required for Document Date so the output of the function does not return blank. This is because if the output date does not exist in the list of dates for our input column, then a blank value will be returned.
Additionally, a date table is needed for the “As-Of Date” slicer so that any date may be selected by the user; not just from the list of dates in the Posting Date field.
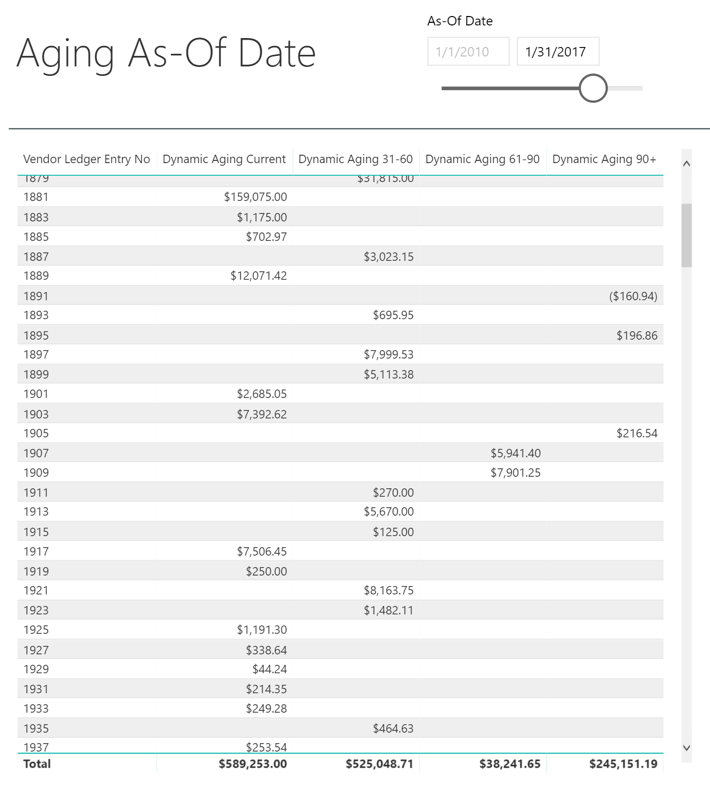
These measures can now be placed on a table visual on a report and will adjust according to the date selected in the “As-Of Date” slicer.
The final report run for Jan. 1, 2017:
More Insights & Help
Feel free to reach out to me at ccollier@credera.com, or find information about our Analytics & Insights service area online if you have any questions. We are always excited to have a conversation around how we can help you tackle your most difficult challenges and enable you to make better, data-driven decisions.
Contact Us
Ready to achieve your vision? We're here to help.
We'd love to start a conversation. Fill out the form and we'll connect you with the right person.
Searching for a new career?
View job openings