Feb 10, 2022
Team Dynamics: How to Use Quantitative Metrics to Assess Agile Team Performance


Most companies strive to deliver time sensitive business imperatives with limited resources. One key to success is unlocking prior investments made in agile best practices to spur faster time to market and improved team productivity. With the goals of understanding delivery speed and effectiveness, it is essential that teams take time upfront to identify the right quantitative insights to measure and optimize success.
One of the world’s largest quick-service restaurant chains that serves over 70 million customers (about twice the population of California) in more than 100 countries daily, engaged Credera to make recommendations to improve quality while reducing time to market for software deliverables. They experience a common problem: project work generally took longer than estimated to complete, and overruns were often not identified early enough in the project to prevent impacts to overall timeline. The norm was for projects to have surprise last-minute timeline shifts, and never in the ideal direction.
Credera leveraged our Agile Teams Dynamics methodology with quantitative and qualitative measures to understand and improve their team efficiency, impact, and health. The continuous improvement approach helped delivery teams reach their peak potential. The transparency allowed the team to demonstrate progress for each sprint and easily identify potential areas of improvement before they became serious issues.
In this article, we will introduce how we help our clients not just identify the right quantitative agile metrics but understand the ‘so what’ of the information and how to use the data for continuous improvement.
How to Manage Team Performance in Agile: Introducing Team Dynamics
Using a framework called Team Dynamics, Credera draws from a comprehensive suite of quantitative and qualitative measures to understand and improve team efficiency, business impact, and health. The continuous improvement approach helps teams reach their peak potential and achieve the greatest outcomes for the business. We will touch on a few common quantitative measures below.
Here are five agile metrics that should be tracked in your agile journey:
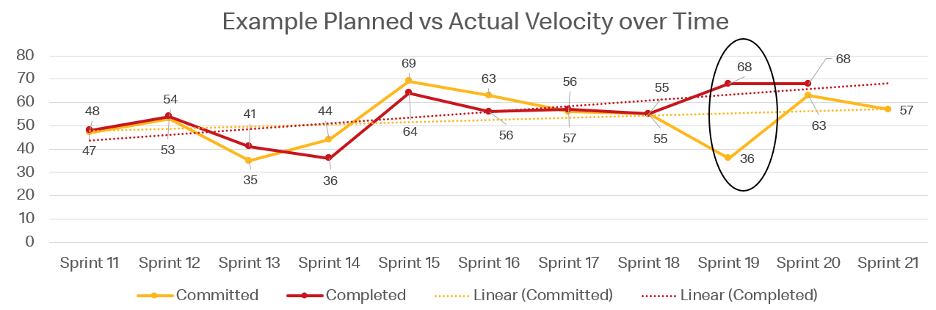
1. Planned vs. Actual Velocity
Deepening the understanding of standard sprint metrics allows us to tell the story of progress while also showing trends and risk.
One common sprint metric is velocity. Velocity allows you to understand how well a team can turn estimates into functionality during a sprint. It is best used as a predictor of reliability. Steady velocity over time shows that a team can estimate successfully.
Effective agile teams are prepared teams as they understand the work before they commit to it with workflows in place to easily move through development, deployment, testing, and approval. Mature agile teams can absorb a small amount of unplanned work without disrupting the overall sprint plan and have a team leader that can protect the team from distractions and ensure any work brought into the sprint late is of high priority.
At the start of the sprint, the team commits to the amount of work they believe they can complete within that sprint. Ideally, the planned work is roughly the same as the actual work completed by the end of the sprint. When it’s not, that can be a symptom of poor team health.
Planning
Knowing the team’s average points per sprint, and the resource availability for the sprint, gives a solid basis for estimating the work that can be completed within a sprint.
Interdependent work, where one piece of work is waiting on other work within the sprint, or work being done by another team, can kill momentum and block progress.
Work Definition
The better understood and decomposed the work is prior to the sprint, the less likely the team member doing the work will face hurdles to getting started.
More complex work should be broken down into smaller pieces, enabling faster building and testing, and ensuring work is accurately measured within the appropriate sprint.
2. Velocity Over Time
Steady velocity over time shows that a team can estimate successfully.
Process Flow
Issues with the overall build/test/release process can be identified by comparing team velocity over time. If a team regularly has a 30% or greater swing in points completed, that can indicate a bottleneck. For example, a client with QA issues, where points from last sprint closed in the first week of the next sprint.
Improvement
A group of resources doing similar work should show improvement over time and then predictably steady. Unplanned work not being captured and dips in discovery quality are two common velocity killers.
Sprint 19 shows a gap in pre-sprint planning, where a much lower than average velocity was assumed on sprint start and a higher-than-average velocity was achieved by sprint end.

Velocity on its own is only one piece of the story. The following should also be considered:
What’s the goal: Where are we going?
What’s the estimate: How long do we think it will take to get there?
What’s the progress so far: How much longer do we have to go?
What’s changed: Since we learn more as we go, has our understanding of the goal, estimate, or progress changed?
3. Burndown
Burndown is another sprint metric key to Team Dynamics. From sprint to sprint, each piece of work goes through a standard set of activities that roughly translate into ‘to do,’ ‘in progress,’ ‘in testing,’ and ‘done.’ More complex pieces of work will take more time ‘in progress’ and ‘in testing,’ lower priority work will spend more time in ‘to do,’ and high priority work should move to ‘in progress’ right away. Burndown shows the aggregate points on their way from ‘to do’ to complete and paints the picture of what happened during the sprint that is missed in velocity.
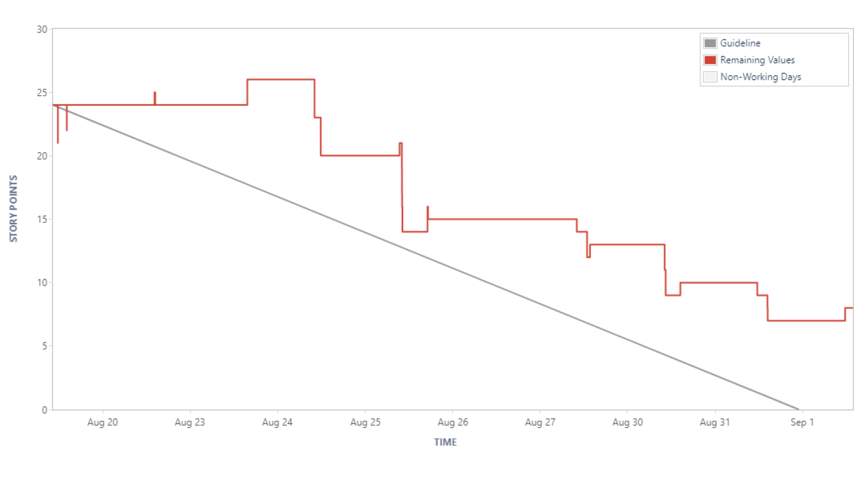
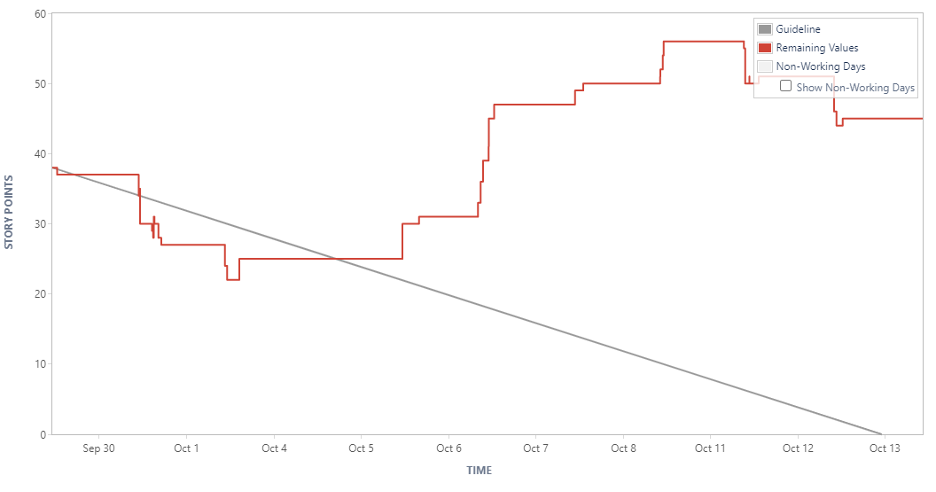
4. Upward Spike
An upward spike means points were added to the sprint after the sprint started. Either points were added or increased on committed work or net new work was added to the sprint. Measuring velocity alone can miss key issues indicated by upward spikes in burndown. The highest priority work ready to be picked up should be committed to at sprint start. New work coming in indicates that higher priority work was not identified earlier in the sprint cycle.
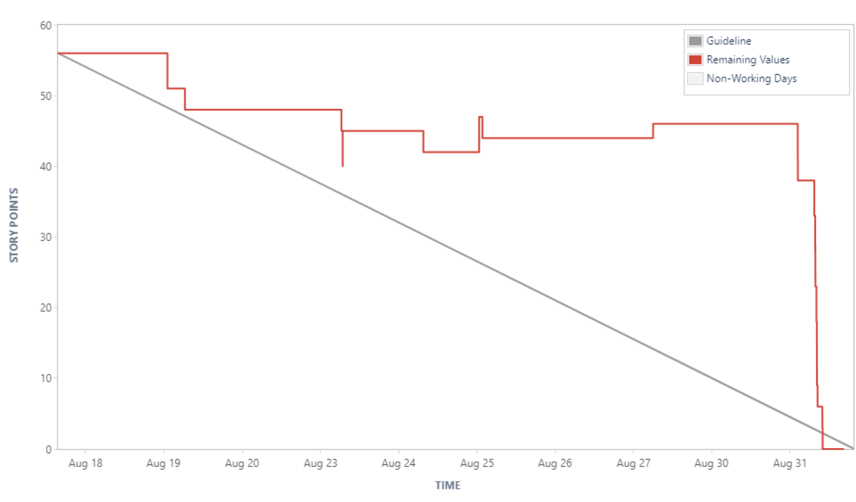
5. Downward Spike
Each downward spike means points were completed or removed from the sprint and shows progress toward completing the sprint work. The timing of each downward spike is important. Well-defined work will have consistent downward spikes throughout the sprint thereby showing consistent progress. A steep downward spike at the end of the sprint indicates issues in ticket management, a bottleneck moving from one state to the next, or insufficient discovery work pre-commitment.
Long Plateaus
A complex piece of work staying ‘in progress’ usually means the work is taking an expected amount of time to complete.
A simple piece of work staying ‘in progress’ usually means the ticket was completed but not updated or there is interdependent work blocking completion.
Steep Decline
If most work is moving to ‘done’ on the last day or two of the sprint, this typically indicates poor ticket management, blockers in moving from one environment to the next, or bottlenecks in testing.
What to Do Next
Metrics are essential to enabling more effective and efficient teams. Take the time to understand what you want to measure, how you plan to do so, and how best to use the information for meaningful improvement.
If you would like to learn more about how Credera can help remove ambiguity and tap into key lessons to improve agile team performance and keep your projects on track, please see reach out to us at findoutmore@credera.com

Jun 5, 2021
3 Ways to Unlock Agile Transformation With the Program Management Office
As we continue to see rapid change in the way IT departments are organized, it is imperative that leadership teams are aware...

Dec 3, 2021
Waterfall or Agile? Or Both?: A Hybrid Project Management Approach
Waterfall has declined in popularity, but old habits die hard. We’re outlining Credera’s hybrid method of project...

Nov 19, 2021
Implementing Agile in a Skeptical, High-Risk Environment
How one medical device company began the process of agile transformation through a partnership with Credera

Contact Us
Let's talk!
We're ready to help turn your biggest challenges into your biggest advantages.
Searching for a new career?
View job openings