Blog
Jan 14, 2016
Tableau Workaround Part 1: Add Last Database Refresh Date to Dashboard


Over recent years, Tableau has become a preferred tool for data visualization and dashboard reporting for many organizations. It’s a solution that is synonymous with striking visuals and simplicity for creating a variety of highly customizable charts. Not surprisingly, many of our clients are interested in making Tableau a part of their reporting/analytics technology toolkit. However, as with any software package, there are limitations that can make you feel like banging your head against a wall. Thankfully, the growing Tableau community offers a plethora of workarounds and hacks. We’d like to contribute by addressing some of the gaps we have encountered while building some rather complex dashboards.
Our first installment in a five-post series will focus on adding “Last Database Refresh Date” to a dashboard. While this might seem simple, continue reading to understand how to overcome the nuances of this task.
Tableau Workaround Part 1: Add Last Database Refresh Date to Dashboard
Tableau has a built-in refresh date that describes when the view was last refreshed and can be easily added to a dashboard. However, this doesn’t tell us when the source data was last refreshed—has any sales data for today been loaded yet? Is everything in the dashboard up-to-date? What if our data load process breaks? These are all questions we can’t answer using Tableau’s refresh date. More importantly, if there is a significant time lag between when events occur (a purchase at a store) and when data flows into the dashboard, users can be misled when displaying Tableau’s refresh date. In order to workaround this issue, we can build our own data refresh date using a custom SQL data connection and source date field to tell us when data has been last loaded.
For this example, we are using the Superstore Tableau workbook in Tableau Desktop 9 and AdventureWorks for SQL Server 2014.
Step 1 – Create a Custom Connection and “Last Load Date” Field
To get started, we need to create a new custom data connection. Open a Tableau workbook and create a new data connection.
After connecting to your data source (in this case we chose a sales table in the AdventureWorks database), select to add a ‘New Custom SQL’. Add a SQL statement to get the max date from your table.
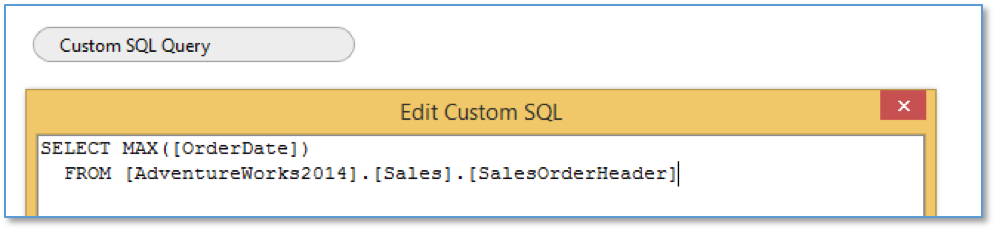

Hit ‘OK’ and go to a new worksheet. Now that we have the last load date, step two will walk through using Tableau formatting to create a worksheet that can be added to any dashboard.
Step 2 – Format the Date
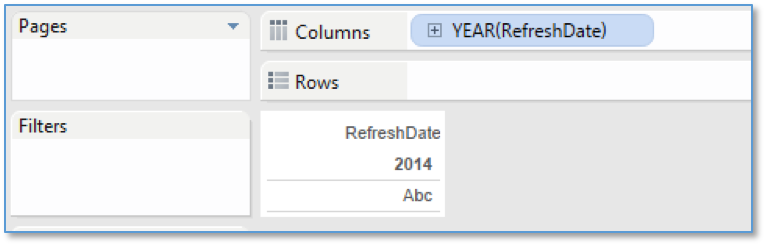
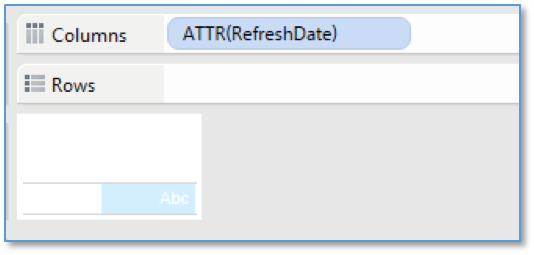
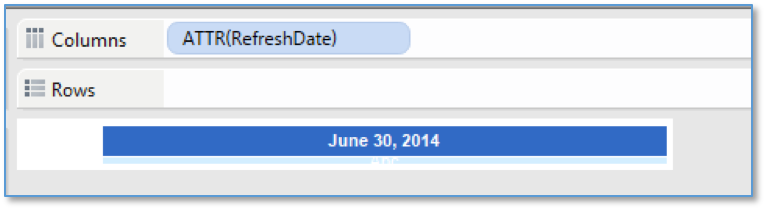
Once you are in a new worksheet, drag the refresh date from your new data connection on the left onto the columns card.
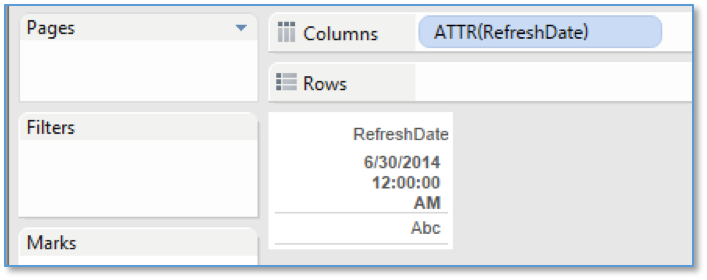
Right click on the newly added field in columns and select to make it an attribute.
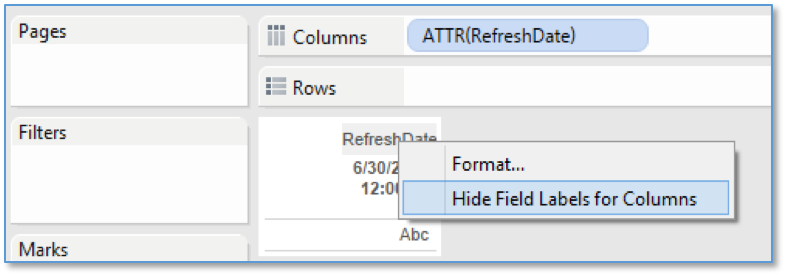
Right click on the header (in this case RefreshDate) and choose ‘Hide Field Labels for Columns’.
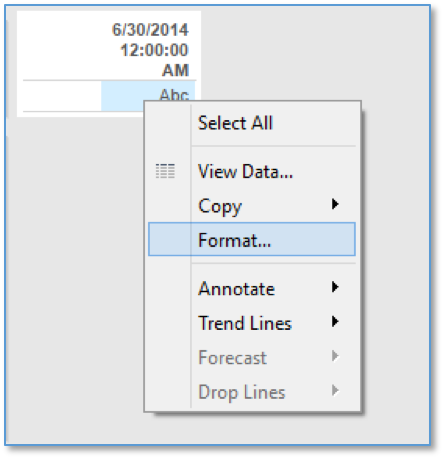
We need to do a little finagling on the worksheet to format the grid, so it looks like a single date and not a report. The first step is to change the color of ‘Abc’ to white. Open format with a right click on the grid.
On the format font on the left go to sheet and under default pane change the color to white. You should see your grid color change.
We want to remove or hide ‘Abc’ from view, so decrease the height and increase the width of the pane by dragging the cursor.
You can still see the grid line here, so we need to remove the lines from the grid. Go to format and select the border, change the color to white for the sheet.
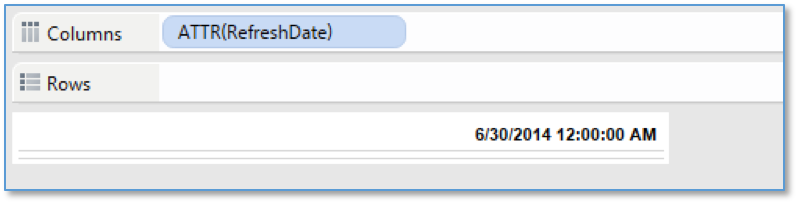
To finish the formatting we need to center the date and change it to the preferred date format. Open format, select the alignment tab, and change the page to center for the sheet. To change the date format make sure you have the date highlighted and go to format. Under default dates select the date format desired.
Step 3 – Add to the Dashboard
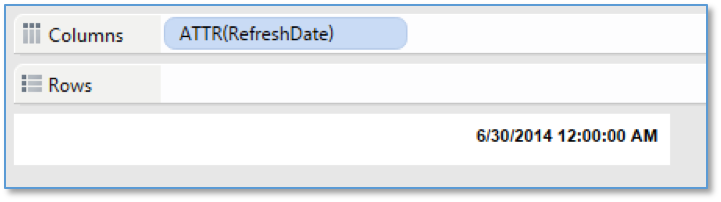
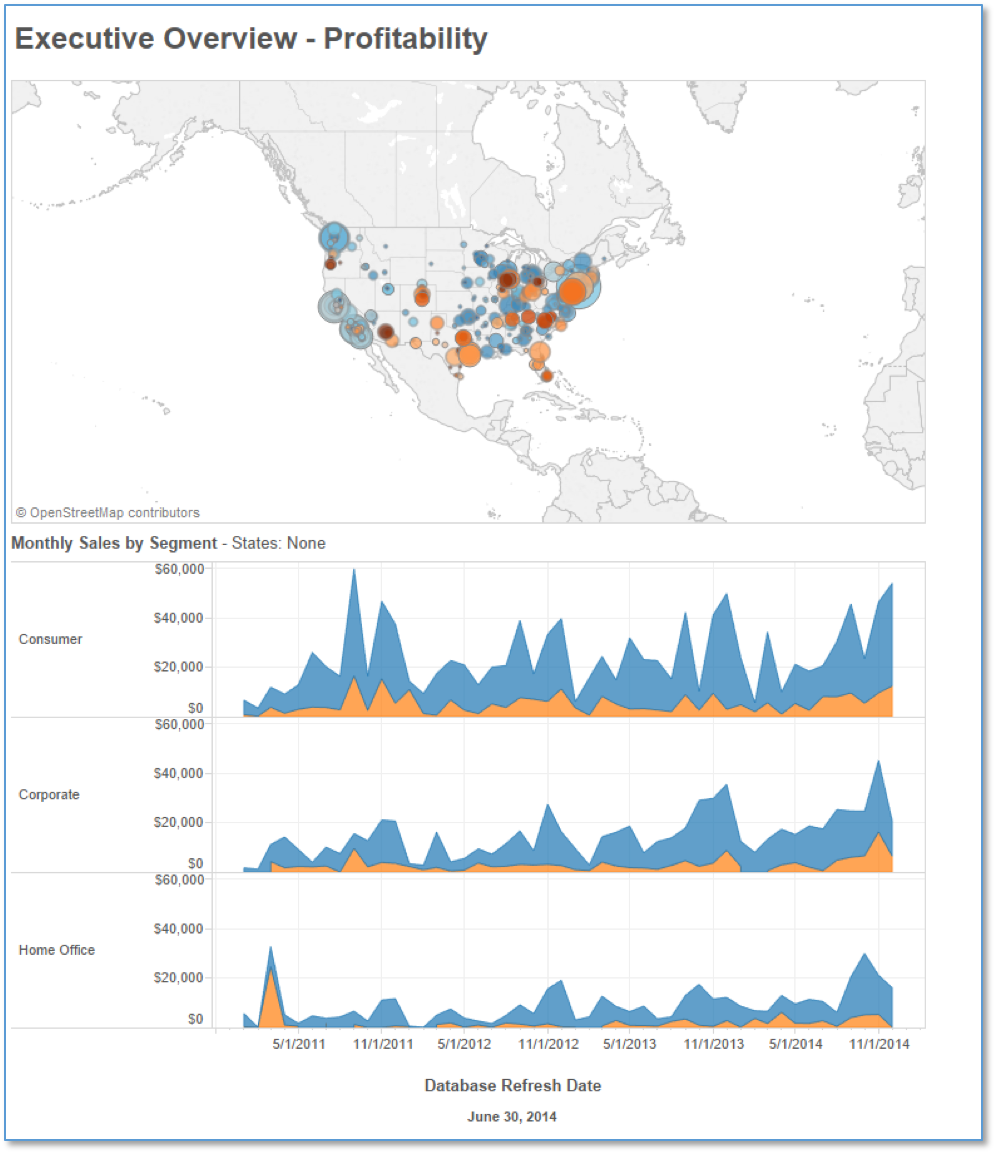
Now that we have the date in a new worksheet we can go to a dashboard and drag on the worksheet as we would any other field. In this case we added it to the bottom of the dashboard and are showing the sheet title as a description for the date.
If you have questions about this blog post, please leave a comment below, tweet us @CrederaIT, or contact us online. Remember to stay tuned for the next installment in our blog series, Tableau Workaround Part 2: Create an Include & Exclude Filter on the Same Field.
Contact Us
Let's talk!
We're ready to help turn your biggest challenges into your biggest advantages.
Searching for a new career?
View job openings