


Credera’s Analytics and Business Intelligence team recently partnered with a large manufacturing company to modernize their reporting ecosystem. After carefully analyzing their current state and future needs, we decided to replace their current solution of SQL Server Analysis Services cubes and pivot table reporting in Excel with a modernized data warehouse and Microsoft Power BI.
The team designed and developed the needed Power BI workbooks and once development, unit testing, and code review was complete, the final step was to publish the workbooks and schedule a refresh using Power BI services. However, during the scheduled refresh we received the following error message:
“The amount of uncompressed data on the gateway client has exceeded the limit of 10 GB for a single table. Please consider reducing the use of highly repetitive strings values through normalized keys, removing unused columns, or upgrading to Power BI Premium.”
Because the development of these workbooks was done locally on our computers, this was not an issue that came up until we published to the Power BI service and tried to schedule a refresh.
Per Microsoft, the data limits imposed on Power BI Pro users are:
Maximum compressed data set size of 1 GB.
Limit of 10 GB on the amount of uncompressed data that is processed during refreshes.
No data size restrictions in Power BI Premium.
The error message provided by Microsoft is informative and provides guidance for a solution, but what if your data is already highly normalized, you have removed unused columns, and upgrading to Power BI Premium is not an option? How do you pinpoint the exact issue, so you know where and how to optimize your data model?
As the team researched the issue, there was a need to analyze the data model that was created by the VertiPaq engine in Power BI. After some research we found a very useful blog post and tool that described how to connect to and analyze the VertiPaq storage structures for the data model and analysis services.
After reviewing the data model size provided by the VertiPaq analyzer tool, the team was able to identity the root cause of the issue. One of Microsoft’s best practices for creating and importing data into Power BI is to limit the width of tables, if possible. The team discovered that the composite keys that were created during development using Power Query M consumed a considerable amount of space as many of the columns used were text values and due to source data and scope of project we were not able to create a singular primary key.
The nature of our dataset required all tables to be joined on at least two columns. Power BI natively only allows joins on a single column so concatenated columns or indexes must be used.
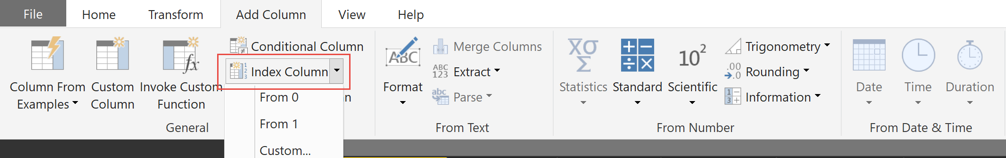
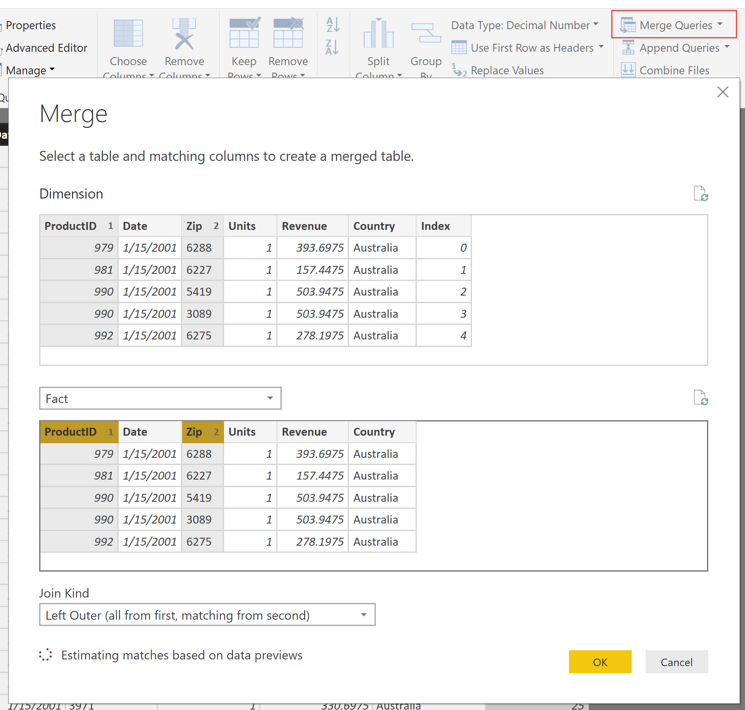
Power BI only allows joins on a single field in the Relationship Editor, but tables can be merged on multiple columns in the Power Query editor. Therefore, our first solution was to use the Index Column and Merge Queries functionality in the Power Query editor. The index column functionality assigns a unique number to every row in the dimensional tables which can be merged back to the fact table using the merge query functionality. The indexed columns can then be used to create the relationship in the relationship editor. However, these steps caused performance issues when refreshing the data set that forced us to consider other options.
Using Index Column to create a primary key on the dimension table that can be used in the Relationship Editor:

Using Merge Queries on the natural key to bring the proper index onto the fact table:
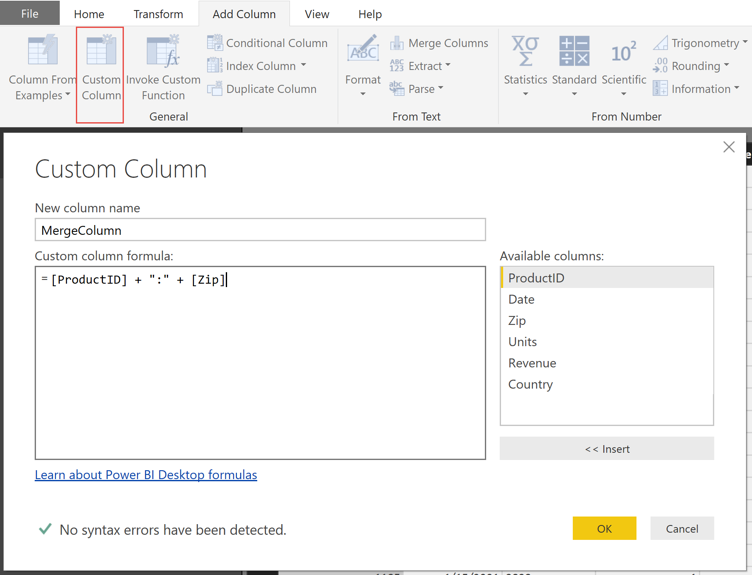
Next the team created a calculated column in M delimited by a colon (e.g., Column A : Column B) on the dimension and fact tables that could be related in the Relationship Editor. Unlike the previous option, this improved performance, but because changes to the data model using M are created on the client-side and must flow over the data gateway the data load size increased dramatically.
Using a Custom Column to create a single primary key:
The final option that yielded the best results was to use DAX to create the same concatenated field using the COMBINEVALUES DAX command delimited by a colon. This does not increase the data size that flows over the data gateway because the columns created in DAX are built after the data loads into the service.
Using COMBINEVALUES to create a single primary key:
Some other changes were made to reduce the data size:
Moved all calculations to DAX to limit dataset size.
Our source application had many decimal fields to 18 places and we reduced that to four decimal places.
Removed redundant columns and normalized data where possible.
There are many ways to model and transform data in Power BI to accomplish your reporting needs. However, each method has its own advantages and disadvantages regarding where the bulk of the calculations take place, refresh time, and modeling capabilities. Knowing where and how to do any calculations and modeling can make a dramatic difference in performance and the refresh time in the Power BI workbook.
Follow-Up Questions
If your company is wondering how to put these tips into practice, feel free reach out to us at marketing@credera.com. We’d love to help as you think through how your company can gain valuable insights through reporting and analytics.

Data
Jan 11, 2018
How to Build Rolling Date Periods in PowerBI
Microsoft has done an excellent job developing PowerBI to be straightforward, enabling everyone from business analysts to...

Strategy
Oct 17, 2018
PowerBI Real-Time Tumbling Windows
Every month Microsoft rolls out new features for Power BI, and I have been impressed by the pace and complexity of this...
Contact Us
Ready to achieve your vision? We're here to help.
We'd love to start a conversation. Fill out the form and we'll connect you with the right person.
Searching for a new career?
View job openings