


Microsoft has done an excellent job developing PowerBI to be straightforward, enabling everyone from business analysts to data visualization experts to build compelling stories with their data. It is this accessibility that has positioned them well as a market leader in the data visualization space, even as a relative latecomer to market. That being said, some functionality can still be challenging to build into your reports. In this post, I’ll share how I added rolling date functionality to PowerBI reports for a recent client.
The Requirements
A client of ours had the following requirements for displaying data points related to prior days, future days, and prior months:
Visualize the preceding rolling seven days of data on a daily chart.
Display the next 30 days’ expected income to provide insight to daily income on individual future days.
Express current month-to-date data as well as the preceding five months to better understand trending in their prior six months of income.
At first glance, this seemed to be a simple set of requirements with simple answers, but it required a good deal of research and QA to deliver a future-proof solution that would persist after our hand over to the client’s support team.
Considerations
Everyone has their own flavor of data, and this client was no different. However, we can generally rely on a few consistent themes in our client’s data:
Date dimension tables are generally available on a client’s source database. If not, Marco Russo provides a very robust DAX date dimension on his Github.
Transactional (or factual) client data will generally have data present with creation or modification timestamps.
Solution 1 – Past Daily Data View
Now, when it comes to daily data the solution is quite simple and elegant. From our data analysis, we would assume the most recent data would almost certainly need to be displayed. There will often be dependencies on the delivery of that data, for example completion of a batch reporting process, a stored procedure, or otherwise. The below process was tailored specifically for this client’s data structures; however, it should be straightforward enough to reuse for your own situation for any number of days.
In the PowerBI Entity Relationship Diagram view, confirm that you have a one-to-many relationship present from your date dimension’s fully qualified date column to your fact table’s date column.
Looking at the Date dimension on the Data view, you can build a new column that I called Days In Past and leverage a DAX formula similar to that below. The new column must have a data type of Whole Number:
Days In Past = MAX (‘FactTable’[TransactionDate]) - DateDim[Date]
On the visual designer view, once you’ve created your visualization and have it selected, for example with date on the x-axis and fact table revenue on the y-axis, you’ll need to drag your new Days In Past column from Fields on the right of your screen to Visual level filters. Then apply the values as in Figure 1 to be inclusive of the current day, zero, and the six preceding days. With the DAX code from step two, day zero will always be your data’s most recent day.
Note that if your PowerBI workbook tab is entirely composed of visualizations featuring daily data only, you can drag the column to the Page level filters section and apply the values in the same way.
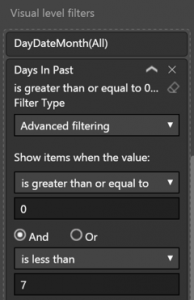

Figure 1 – Rolling Seven Days in Past Filter Rules
Solution 2 – Future Daily Data View
The approach to filtering a rolling window for our future data is quite similar to Solution 1, with a couple of minor tweaks.
As before, ensure an appropriate relationship between your date dimension and fact data.
Since your future data will almost certainly be related to the current date, as opposed to historical data, you can alter the DAX formula to be a little more straightforward. On the Data view create a new column, I’ve called it Days In Future, using a DAX formula similar to the following:
Days In Future = DateDim[Date] - TODAY()
Back to the main dashboard view, with a new visualization created using dates on the x-axis and appropriate factual data on the y-axis, add your Days In Future column to either your Visual level filters or Page level filters as needed using the filter rules as shown in Figure 2.
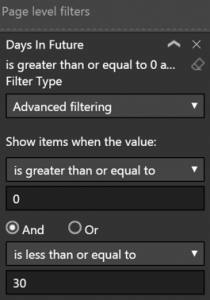
Figure 2 – Rolling 30 Days in Future Filter Rules
Solution 3 – Past Monthly Data View
While the concepts are similar between the months in past and days in past solutions, the execution on months in past must be different due to the way that PowerBI parses month values separately to year values. This can create issues when your date window crosses a year-to-year threshold.
1. Once again, confirm you have a one-to-many date relationship in place between your date dimension and the fact table’s date column.
2. In PowerBI’s Data view, create a new column called Months In Past with a Whole Number data type and leverage a DAX formula similar to below to suit your data structure.
Note that in this instance, since the DATEDIFF function cannot be used to calculate negative values, you need to wrap the calculation statement in an IF and set all false instances to be -1 so as not to interfere with filters later:
Months In Past =
IF (
DateDim[Date] <= MAX ( ‘FactTable’ [TransactionDate] ) , DATEDIFF ( DateDim[Date] , MAX( ‘FactTable’ [TransactionDate] ) , MONTH ) , -1
)
3. Having created the new column and built a visualization featuring monthly and factual data you can now drag the Months In Past column to your visual or page filters. Apply the values as I’ve done in Figure 3 to feature the current and prior five months to demonstrated a rolling six months of data.
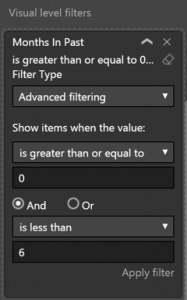
Figure 3 – Rolling Six Months in Past Filter Rules
This solution can also be extended out to quarters or years in the past as well. This can be particularly helpful for publicly traded companies where quarters can be key. Furthermore, this would allow you the flexibility to look at year over year by applying an additional Months In Past filter as a measure for greater than or equal to 12 and less than 18 months.
In an update several months ago, PowerBI now features a date slider. It can be used by leveraging the slicer with dates, however you are not able to limit the range of the slider on a rolling basis relative to your data day. You can, however, easily leverage the date sliding slicer in combination with the above functionality if you want to slice by day within the current or previous months.
Final Thoughts
Here we’ve demonstrated a powerful combination of features in PowerBI. This is simply one of many powerful combinations that exist within the application. While PowerBI can feel like a complex tool to IT decision makers, with a strong corporate vision and a proven team willing to guide you and share in the journey, you can be up to speed in no time.
Feel free to reach out to me at aforeman@credera.com with questions or contact us online if you would like more information about working with our team to either attend or set-up a Microsoft Dashboard in a Day event for your company.
Contact Us
Ready to achieve your vision? We're here to help.
We'd love to start a conversation. Fill out the form and we'll connect you with the right person.
Searching for a new career?
View job openings