


It’s that time of the year again. The weather is starting to change, collegiate polos are showing up in the office, and Tony Romo is out with an injury. Football season is clearly back in America, and along with it comes fantasy football. According to the Fantasy Sports Trade Association, 57.4 million people played fantasy sports in the U.S. and Canada last year, making it one of our most popular pastimes. For some, it’s a way to make less appealing games more interesting (looking at you, Jaguars), but for me, it’s a great way to stay in touch with old friends.
There’s a lot that goes into a good fantasy football season, but it is impossible to overlook the draft. If you make uninformed decisions when picking your team, the odds are against you on day one. While I enjoy fantasy sports, I am not the type to spend hours reading articles and rankings from fantasy experts. I’m also not the type to go into something without doing some research and analysis. This led me to look for an alternative way to pull relevant fantasy data and gauge the value for each player. That’s where Microsoft Power BI came into play.
What’s Power BI?
According to PowerBI.com, “Power BI is a collection of software services, apps, and connectors that work together to turn your unrelated sources of data into coherent, visually immersive, and interactive insights.” In other words, Power BI allows you to pull key data, transform it into a usable format, and develop reports and visuals that enable actionable decision making. Given the large amounts of data processed every day, this type of software can be incredibly valuable for a wide range of organizations. Imagine being able to easily pull online sales data by region to help determine where your next distribution warehouse should be. Or in this particular case, being able to pull fantasy football data to avoid embarrassing yourself on draft day. Here’s how I did it:
Importing Data
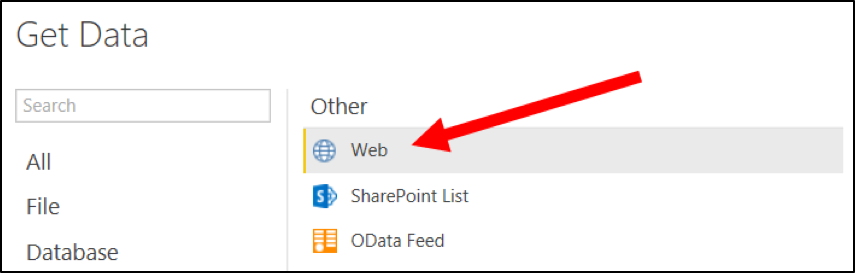
After installing Power BI Desktop, I needed to pull in the necessary data to build my report. Power BI allows users to easily connect to a wide variety of data sources, including SQL server databases, Excel spreadsheets, Oracle databases, and Azure Blob Storage. I was most interested in pulling data from multiple websites to create my data source.
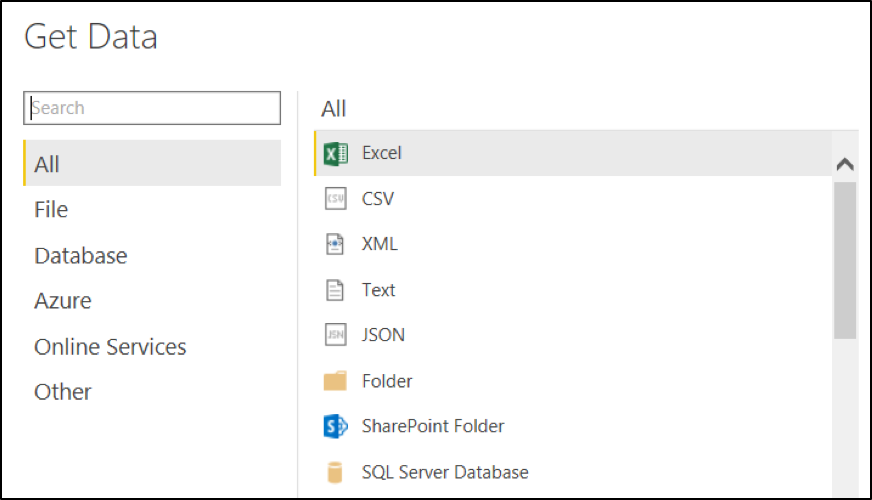

By using the web connection tool, I was able to quickly pull player rankings directly from ESPN.com, NFL.com, Yahoo.com, and FantasyPros.com. Additionally, I brought in live injury report data and key statics from the 2015 season (touches, targets, points, etc.).
Cleaning Up the Data
Of course, the data from each source was similar, but not exactly how I needed it. Fortunately, Power BI has several easy to use tools that allowed me to transform that data by removing columns, appending queries, and splitting out columns by a common delimiter.
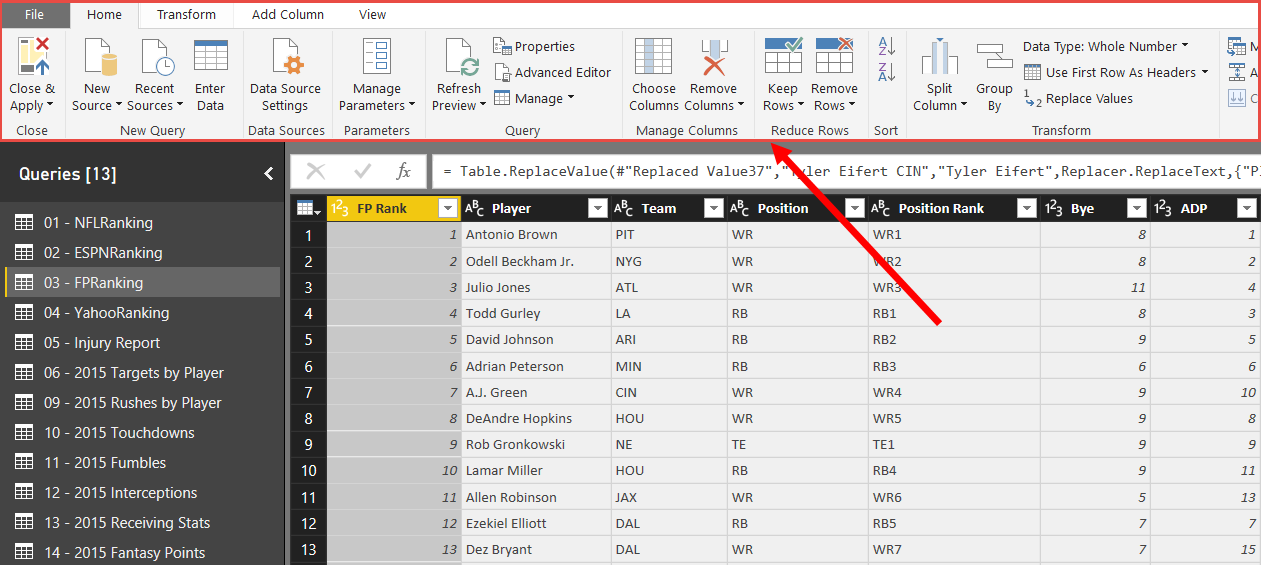
More importantly, Power BI stores all updates under the Applied Steps for each query. This allowed me to schedule a refresh of the data without ever worrying about cleaning the data again. Power BI automatically applies my previous steps to the data as it pulls it back in.
Building the Report
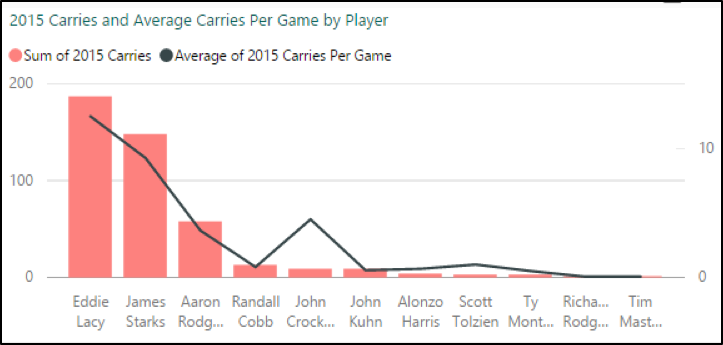
After cleaning up my data, I needed to start building my report. Power BI has 27 visualization templates to help present data in the most effective way possible. One of my favorites is the map visualization that recognizes geographic data and pulls it into your report using Bing maps. Since I was just doing fantasy football analysis, I stuck with tables, bar charts, and slicers. For the visual below, I used the line and stacked column chart. This allowed me to show 2015 total carries and average carries per game (two very different numbers) on the same chart.
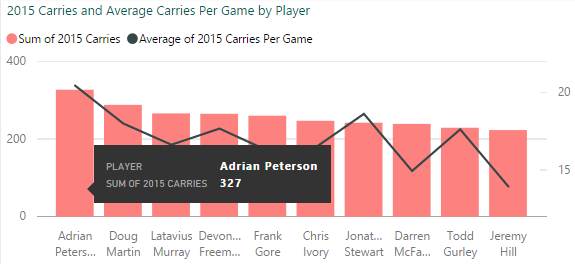
Side Note: How about AP’s carries last year? The guy just doesn’t age.
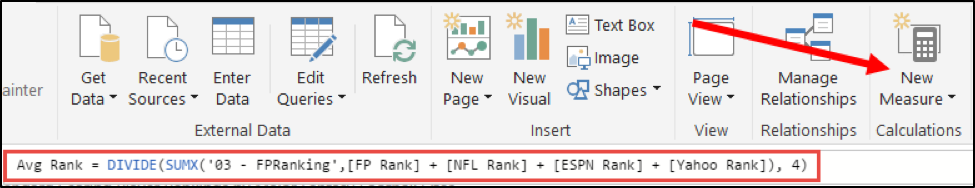
Since I was pulling in rankings from several sources, I wanted to get an average ranking across the various websites. To do this, I created a new Measure that took the sum of each player’s rankings and divided it by four. Similar to Power Pivot and SSAS Tabular, Power BI uses Data Analysis Expressions (DAX) as its formula language.
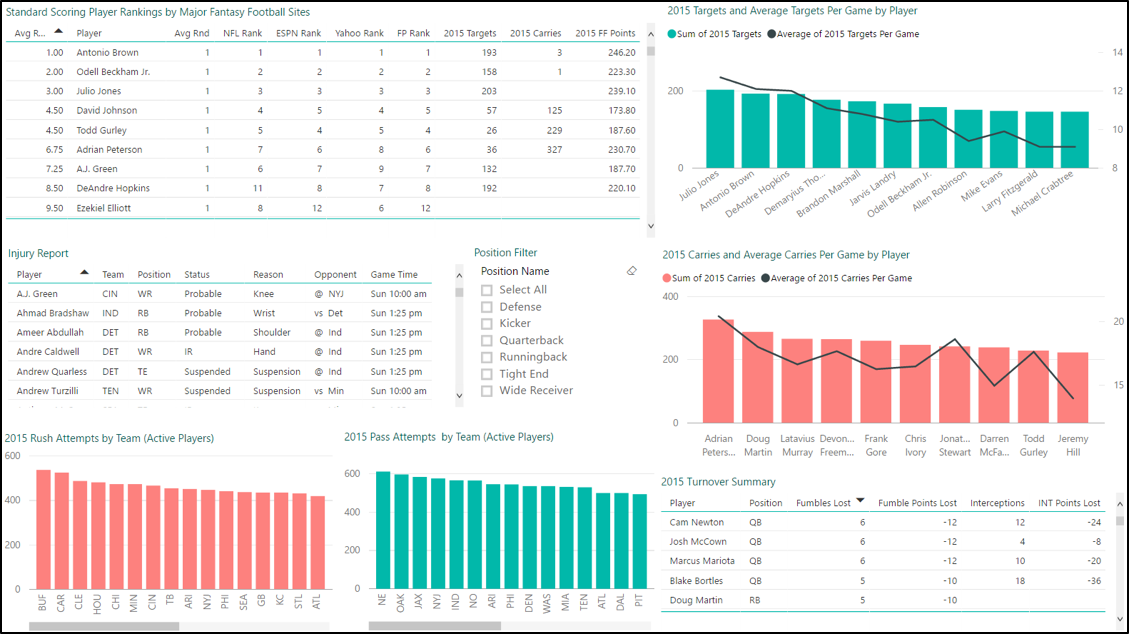
After creating a few measures, I felt like I had all of the data I needed to gain some insight on player value. Using Power BI’s drag and drop functionality, I created tables to display average player rank, injury updates, and key 2015 statistics. Additionally, I added bar charts to show both targets and rushes by player and team.
Creating Data Relationships
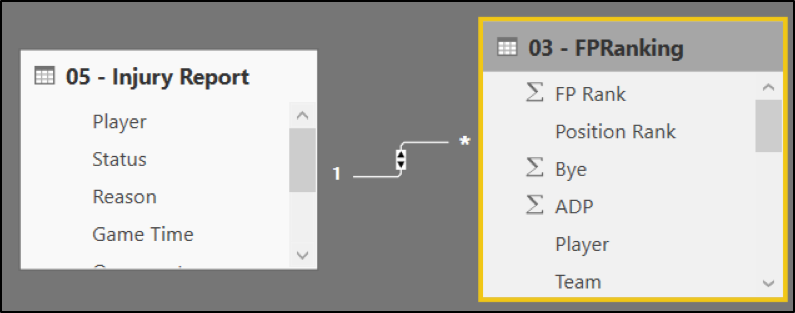
Power BI will detect and create relationships between your data by default, but relationships between data sources can also be maintained through the Relationship view in Power BI. This was helpful when creating my report since I combined several data sources.
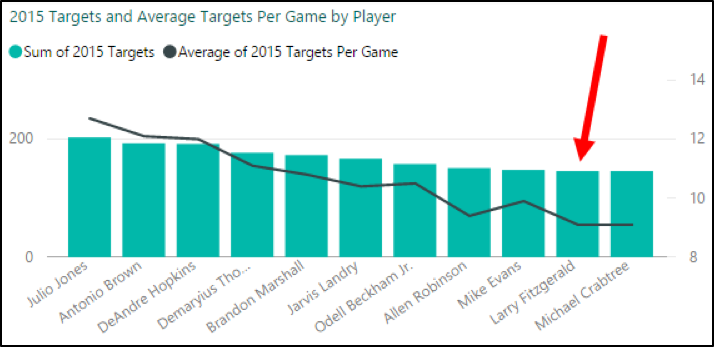
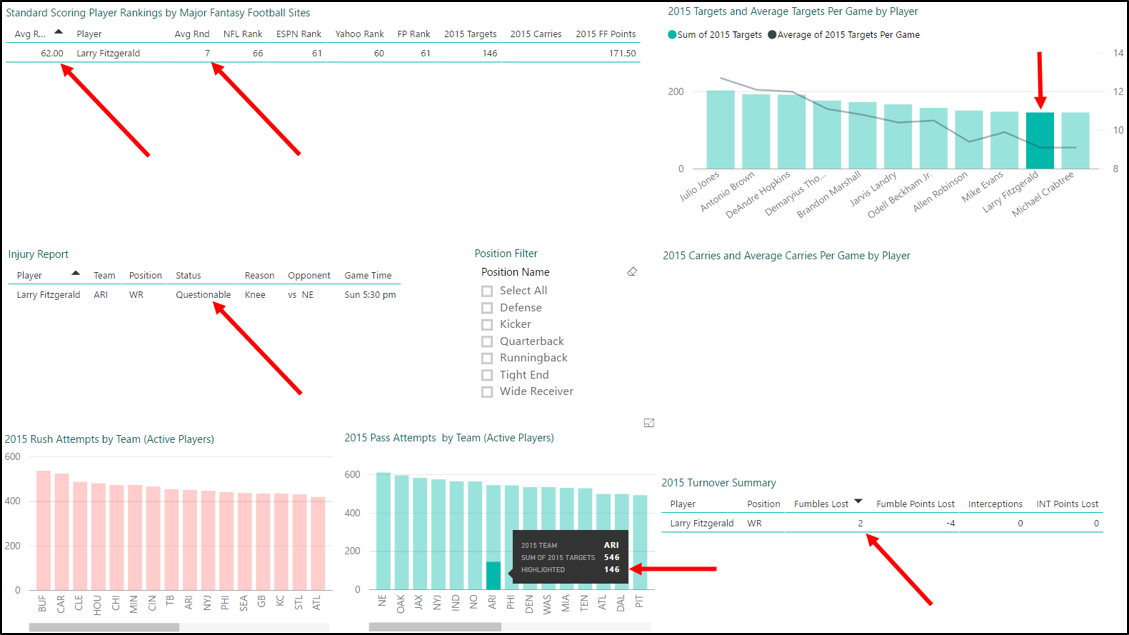
After confirming data relationships, you’re able to interact with the report in some really neat ways. For example, I can see in the top right visual that Fitzgerald was 10th in targets last year, but I am not sure where he falls in the other categories.
Side Note: Check out Crab sneaking in there at 11. Did not see that coming.
After clicking on Fitzgerald’s bar in the targets visualization, the report tables update to show me that he has an average ranking on 62, he’s typically drafted in the 7th round, and he’s currently listed as questionable with a knee injury. He received 146 of Arizona’s 546 pass attempts, and he only lost two fumbles last year.
I can also click on a particular team within the two bottom left visuals to see corresponding data in the other charts and tables. By clicking on Green Bay in the 2015 rush attempts by team visual, my 2015 carries and average carries per game chart updates to only display the breakdown for carries in Green Bay.
Putting the Data to Work
Using these tools, I was able to pull some really helpful data into my report, but we’ve only scratched the surface of the reporting capabilities in Power BI. When fully utilized, it can provide truly valuable insight for a wide array of users. Only time will tell, but hopefully it will help me out in my fantasy league as well.
Be on the lookout for follow up posts on the steps required to build this report and other practical uses of Power BI. And it may be too late for your draft, but you can check out the full report here.
Contact Us
Ready to achieve your vision? We're here to help.
We'd love to start a conversation. Fill out the form and we'll connect you with the right person.
Searching for a new career?
View job openings