


The Chrome Developer Tools (DevTools for short) are a set of web authoring and debugging tools built into Google Chrome. DevTools has taught me most of what I know about CSS and makes Chrome my most valuable application. Spending endless hours in the elements panel with the “Inspect” feature has allowed me to experiment, test, and iterate on sites and applications on the fly.
Whether you’re just starting out in web development or a seasoned veteran, here are five helpful things you may not know that DevTools, and specifically Inspect Element mode, can do. Instructions below are for Mac users. If using a non-Mac (PC), simply replace the “Command” button with “Ctrl.”
1. Set the DevTool’s Background to Black
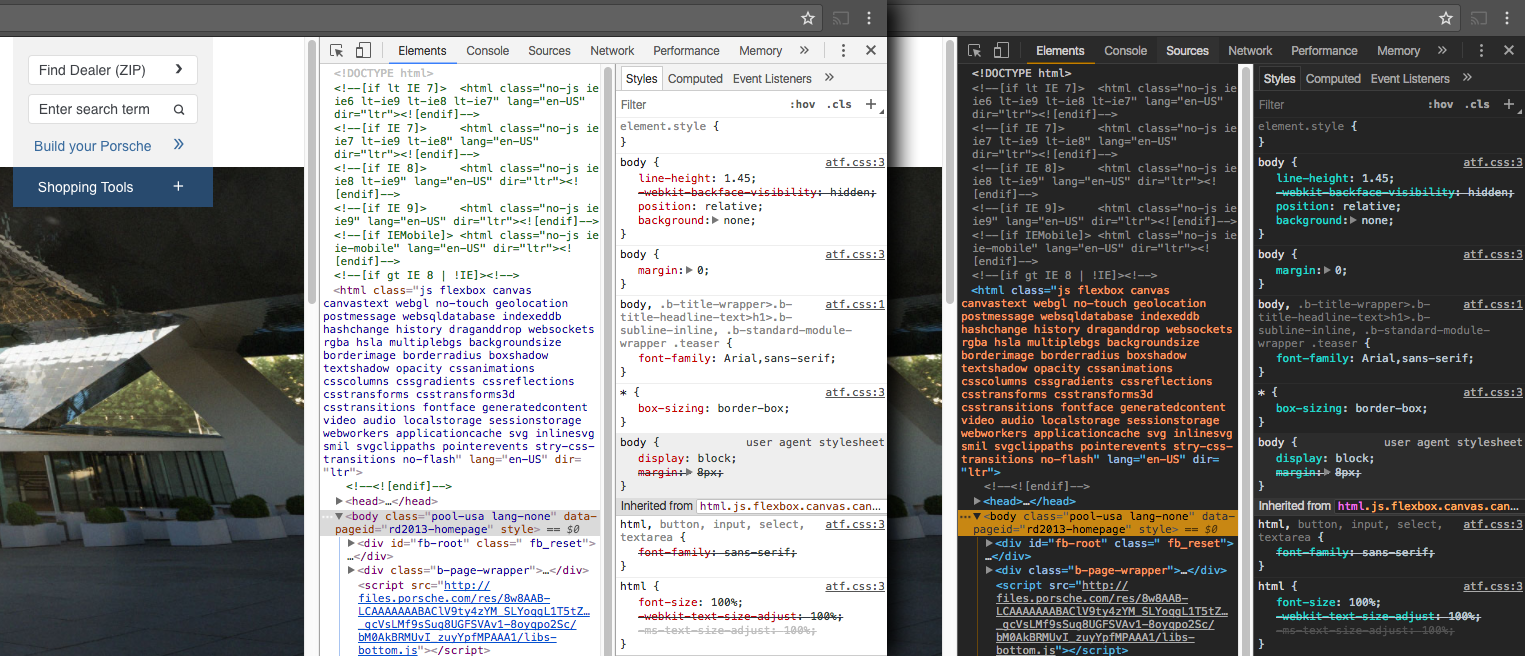

Developers love coding with a dark background. Why should Inspector Mode be any different? Lighter colored text on a virtually black background (#242424 if you want to be more precise) is easier on the eyes and can offer a better separation of where the site ends and the DevTool begins. Give it a shot.you go #242424, you’ll never go back
Here’s how:
Open DevTools.
Click the “Customize and control DevTools” menu indicated by three stacked dots in the upper right corner.
Choose “Settings.”
Go to Preferences > Appearance > Theme > Dark.
2. Right Click the Reload Button for Reloading Options
When DevTools are present, you can right click on the reload button to expose three options: Normal Reload, Hard Reload, and Empty Cache and Hard Reload. This can be particularly helpful when debugging issues related to cache.

Here’s how:
Make sure DevTools are open/exposed.
Right click on the “Reload” button (or alternatively, click and hold the reload button).
Choose your reload option.
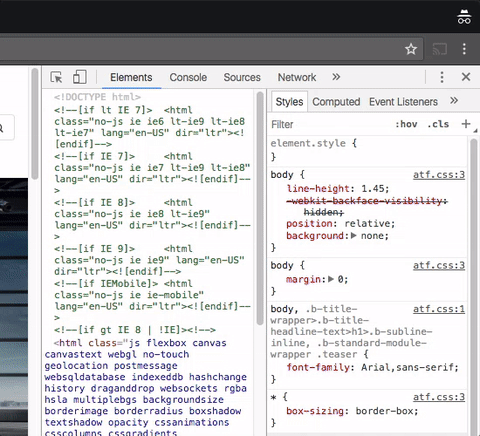
3. Zoom in and out of the DevTools
Just like zooming in the browser, put the mouse’s focus in the DevTools and press Command–Plus sign (+) to beef up the font size if you have the extra screen real estate or if your eyes aren’t what they used to be. Or zoom out to get the most amount of code on screen as possible, using Command–Minus sign (-). Revert to the default size by using Command–0 (zero).
Large text:
Small text:
4. Adjust Numerical Values in Increments of 100, 10, 1, or .1
If you’ve used Sketch or Photoshop, you’re probably familiar with the arrow keys changing values one unit at a time, or by 10 at a time when combined with holding down the Shift key. The same works in DevTools when modifying numerical CSS values. Select the value you wish to change and press the up and down arrows to change the value. Hold Shift while pressing up or down to change the value in increments of 10. Lastly, if you’re working with larger numbers, use the arrows while holding Command to add/subtract 100 units at a time.
Here’s how:
100 = Command–up/down arrow (Ctrl–up/down arrow)
10 = Shift–up/down arrow
1 = Up/down arrow
1 = Option–up/down arrow (Alt–up/down)
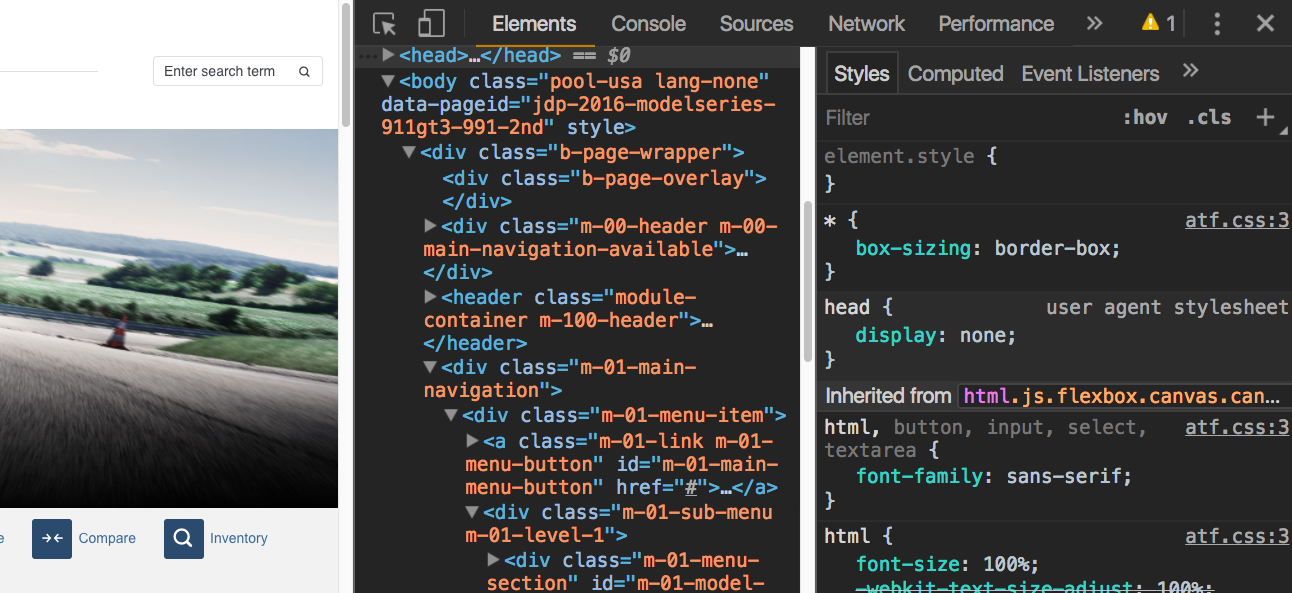
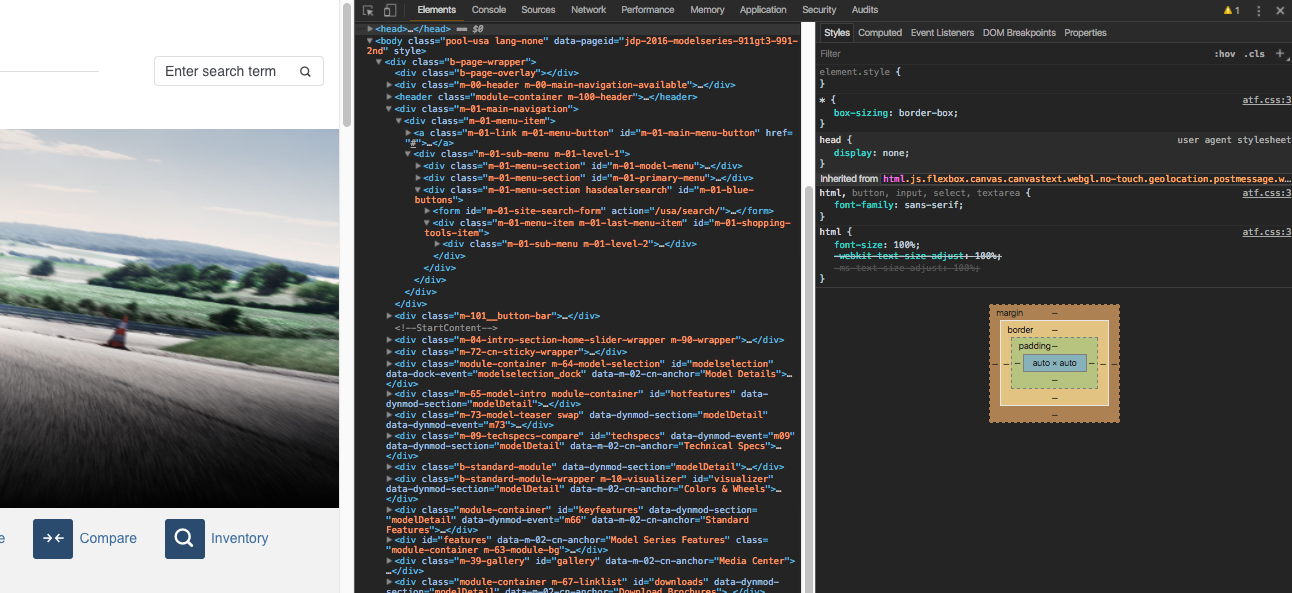
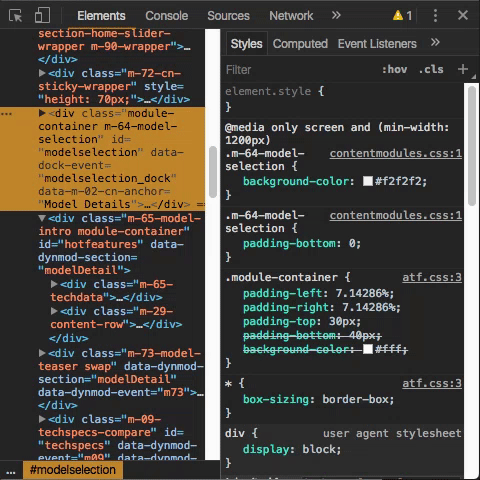
5. View and Prettify Minified CSS
When inspecting an HTML element on the page, you can view its CSS properties. If the declarations are not inline you can even view the actual CSS file from which it is generated. This can be quite helpful when tracking down specificity issues or locating where items show up in the CSS.
Here’s how:
Choose the element you want to inspect.
Locate the selector in the “Styles” tab; To the right of the selector is a file name followed by a colon and a number (this is the originating file name and the line number where the corresponding selector is located); Click the file name.
It displays that file in the “Resources” panel and places focus in the exact location of the selector; If the CSS is minified, click the curly brackets (braces) toward the bottom to make the stylesheet more legible.
Once again, place the cursor focus in the exact location of the selector; You can even edit CSS in this view.
These are just a fraction of Chrome’s DevTools capabilities to make developing easier and faster. Take some time to explore what it has to offer and see if these tips can help you in your future development. For more help, check out these debugging tips from Jose Gonzalez.
Do you have any DevTools tips or tricks that help you? Please share below!
Contact Us
Ready to achieve your vision? We're here to help.
We'd love to start a conversation. Fill out the form and we'll connect you with the right person.
Searching for a new career?
View job openings