
Blog
Aug 1, 2022
Data Quality Series Part 5: Automating Data Quality for Modern Architecture


Our previous post - part 4 of the data quality series - introduced the practice of Data Reliability Engineering (DRE), its core components, and the value proposition for both data engineering teams and data consumers. In this next installment, we focus on the steps necessary for automating data quality.
The steps outlined in this article can be implemented independently and still improve data quality efforts. However, the largest impact will be had by using these steps together as building blocks- each leveraging the contribution provided by other parts of the whole. Modern data architectures are especially adept at enabling this latter approach, but even legacy applications can benefit from the implementation of the one (or two) components that increase quality the most.
Embedding Data Quality into the Development Process
Much of the interesting progress in the field of automated data quality is aimed at moving data quality into the data product development process, both at design, implementation, and run time. Most data teams know the details of the tests and data cleansing steps that are run on their data, the common problems that occur in their source data, the source to target mappings for each field (also known as lineage), and the logic used to transform the data.
However, this knowledge is locked up within the team, either in loose documentation, or solely in the heads of the people on the team. Data teams are familiar with instrumenting our business processes to optimize to using data products. Building an effective DRE system requires changing and instrumenting the data product development process in a similar fashion.
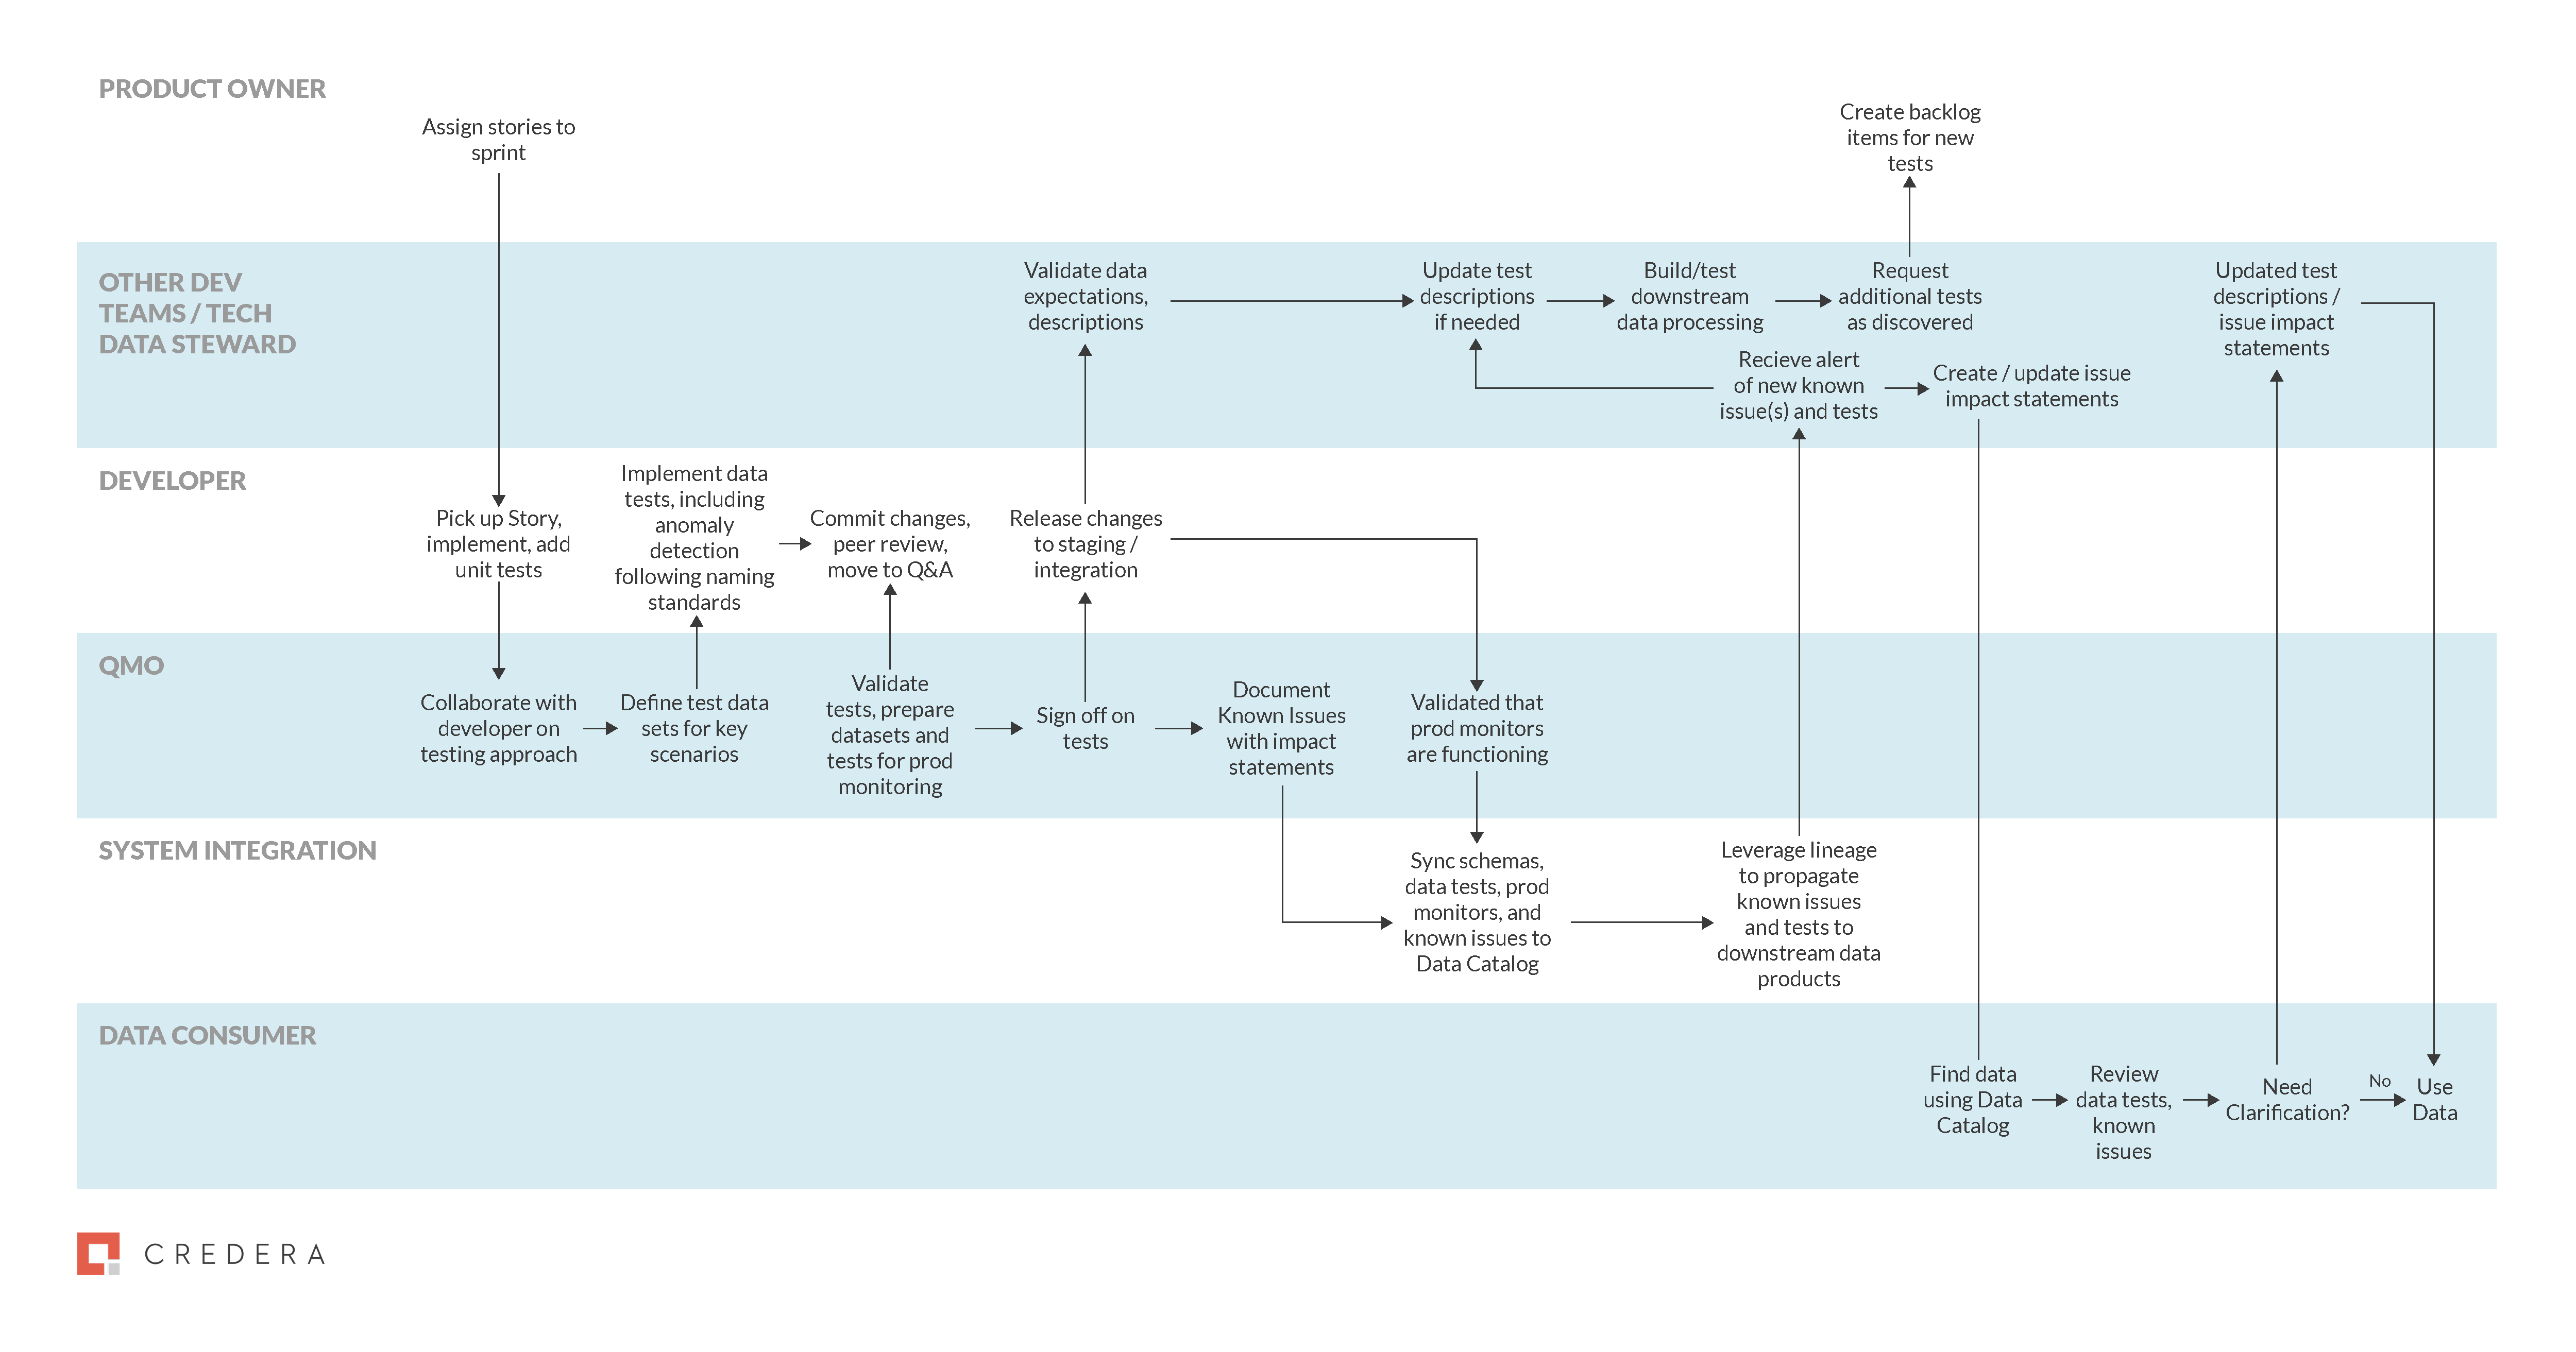
Figure 1: Data Testing, Cleansing, and Monitoring in the Data Product Development Process

Picking Tools to Standardize Transformation Processes
While building your data stack, it’s wise to favor tools that make it easy for data engineers or analysts to “do the right thing.” Otherwise, data quality best practices may easily fall to the wayside over the course of the development cycle. Today, code-based tools like dbt or Sparkmake this easiest, although graphical tools are improving. Making these tools easy to use in your data platform, and guiding teams to use them during the planning phase, ensures that lineage will be available to make data quality metrics more available.
In addition to clear lineage, these tools offer SQL templating functionality which “bakes-in” data quality into pipeline code by forming standards around specific transformations. These templates are defined as parameterized SQL queries, configurable via YAML file or scripting process. Focusing on standardization across your DRE systems not only leads to greater reliability in data products, but can also facilitate collaboration across teams and between data consumers and producers.
Collaborating with Stakeholders to Define Data Quality Checks
During the development process, you should regularly dedicate time (i.e. during backlog grooming) to capturing the data quality expectations of downstream consumers as a first step to build trusting in your data products. This activity also enables both sides to agree on which quality checks should be universal on an upstream data product, and which should be implemented specifically on a downstream data product.
Borrowing from the microservices community, the best practice is to implement all of the most important data quality checks upon loading source data. Doing so prior to processing steps ensures that the data source can be changed without risk of breaking critical functionality.
When data teams are operating in a distributed or self-service fashion, this process involves identifying the scope of change, using data lineage to assess stakeholder impact, proactively inviting stakeholders to preview data changes and raise concerns, and leveraging the conversation to determine the contract tests that should be enforced at the source.
In today’s WFH world, communication tools like Teams or Slack can help facilitate these impromptu group conversations, making them a part of the organizational culture. These communications are easier when everyone is speaking using the same terminology, so starting to build, and eventually training on a data issue taxonomy that fits your organization can accelerate collaboration. This can be accomplished by enforcing descriptive test naming (potentially using BDD standards) via automated checks in the CI process. From there, the system can extract test names from test outputs and tie tests to individual tables and columns via analyzing the assertions used in the tests.
Deploying Code Changes
Finally, when deploying changes to data transformations, teams should use deployments with parallel processing of all data in old code and a portion through the new code (often called blue-green or canary deployments). The development and/or QA team should check the quality metadata derived from their test suites running over production data before ramping up the new code to process all data and performing a go-live swap to replace the old-code outputs with the new outputs for all downstream processes. This favors moving fast with CI/CD processes to get changes into production on a regular basis, reducing the debugging effort when something changes, and thereby producing faster fixes that build data consumer trust.
Automating in Production
By integrating observable data quality into the data product development process (via contract testing, expectations frameworks, testing metadata capture, and CI/CD processes) you will have created a set of tests that ensure quality on the way to production. However, a key difference between data engineering and traditional software engineering is that the data in production is not predictable.
Defining Tests in Production
To guard against this, some of the expectations and tests already created should be run in production as well as the development / release process. Not all tests should be run in production. Some may be too expensive to run, and others may be based on a particular edge case represented in a test dataset.
Developers and data stewards should identify how useful the tests are that should be run in production. Ideally, this would be done by leveraging code annotations and generating pull requests in an everything-as-code environment.
Enabling Anomaly Detection
Additionally, critical data elements should also have a layer of anomaly detection, enabling management by exception. For critical data and data products that already existed ahead of your modern data quality push, anomaly detection provides a low-effort way to ensure that the team is aware of dramatic changes in the data.
There are many tools for anomaly detection, from Anodot, which is designed as a general purpose tool for detecting business anomalies (using ML techniques) to rolling average deviation expectations in Great Expectations (not ML) and built-in functions in most streaming platforms such as Kinesis Analytics. Most commercial data quality products also offer this as well (Collibra data quality, Soda, DataBand, etc.).
Monitoring and Alerting
Finally, all data should be monitored for transient issues. Processing job failures caught using typical observability tools (i.e. DataDog, Amazon Cloudwatch, Azure Application Insights), with these alerts tied back to the data pipelines that are affected. Row counts should be checked during data replication and update delay monitored on stream systems to track how far behind real time the stream is. To determine which data products are being utilized, usage and access should be tracked on the data sets at the end of the pipelines.
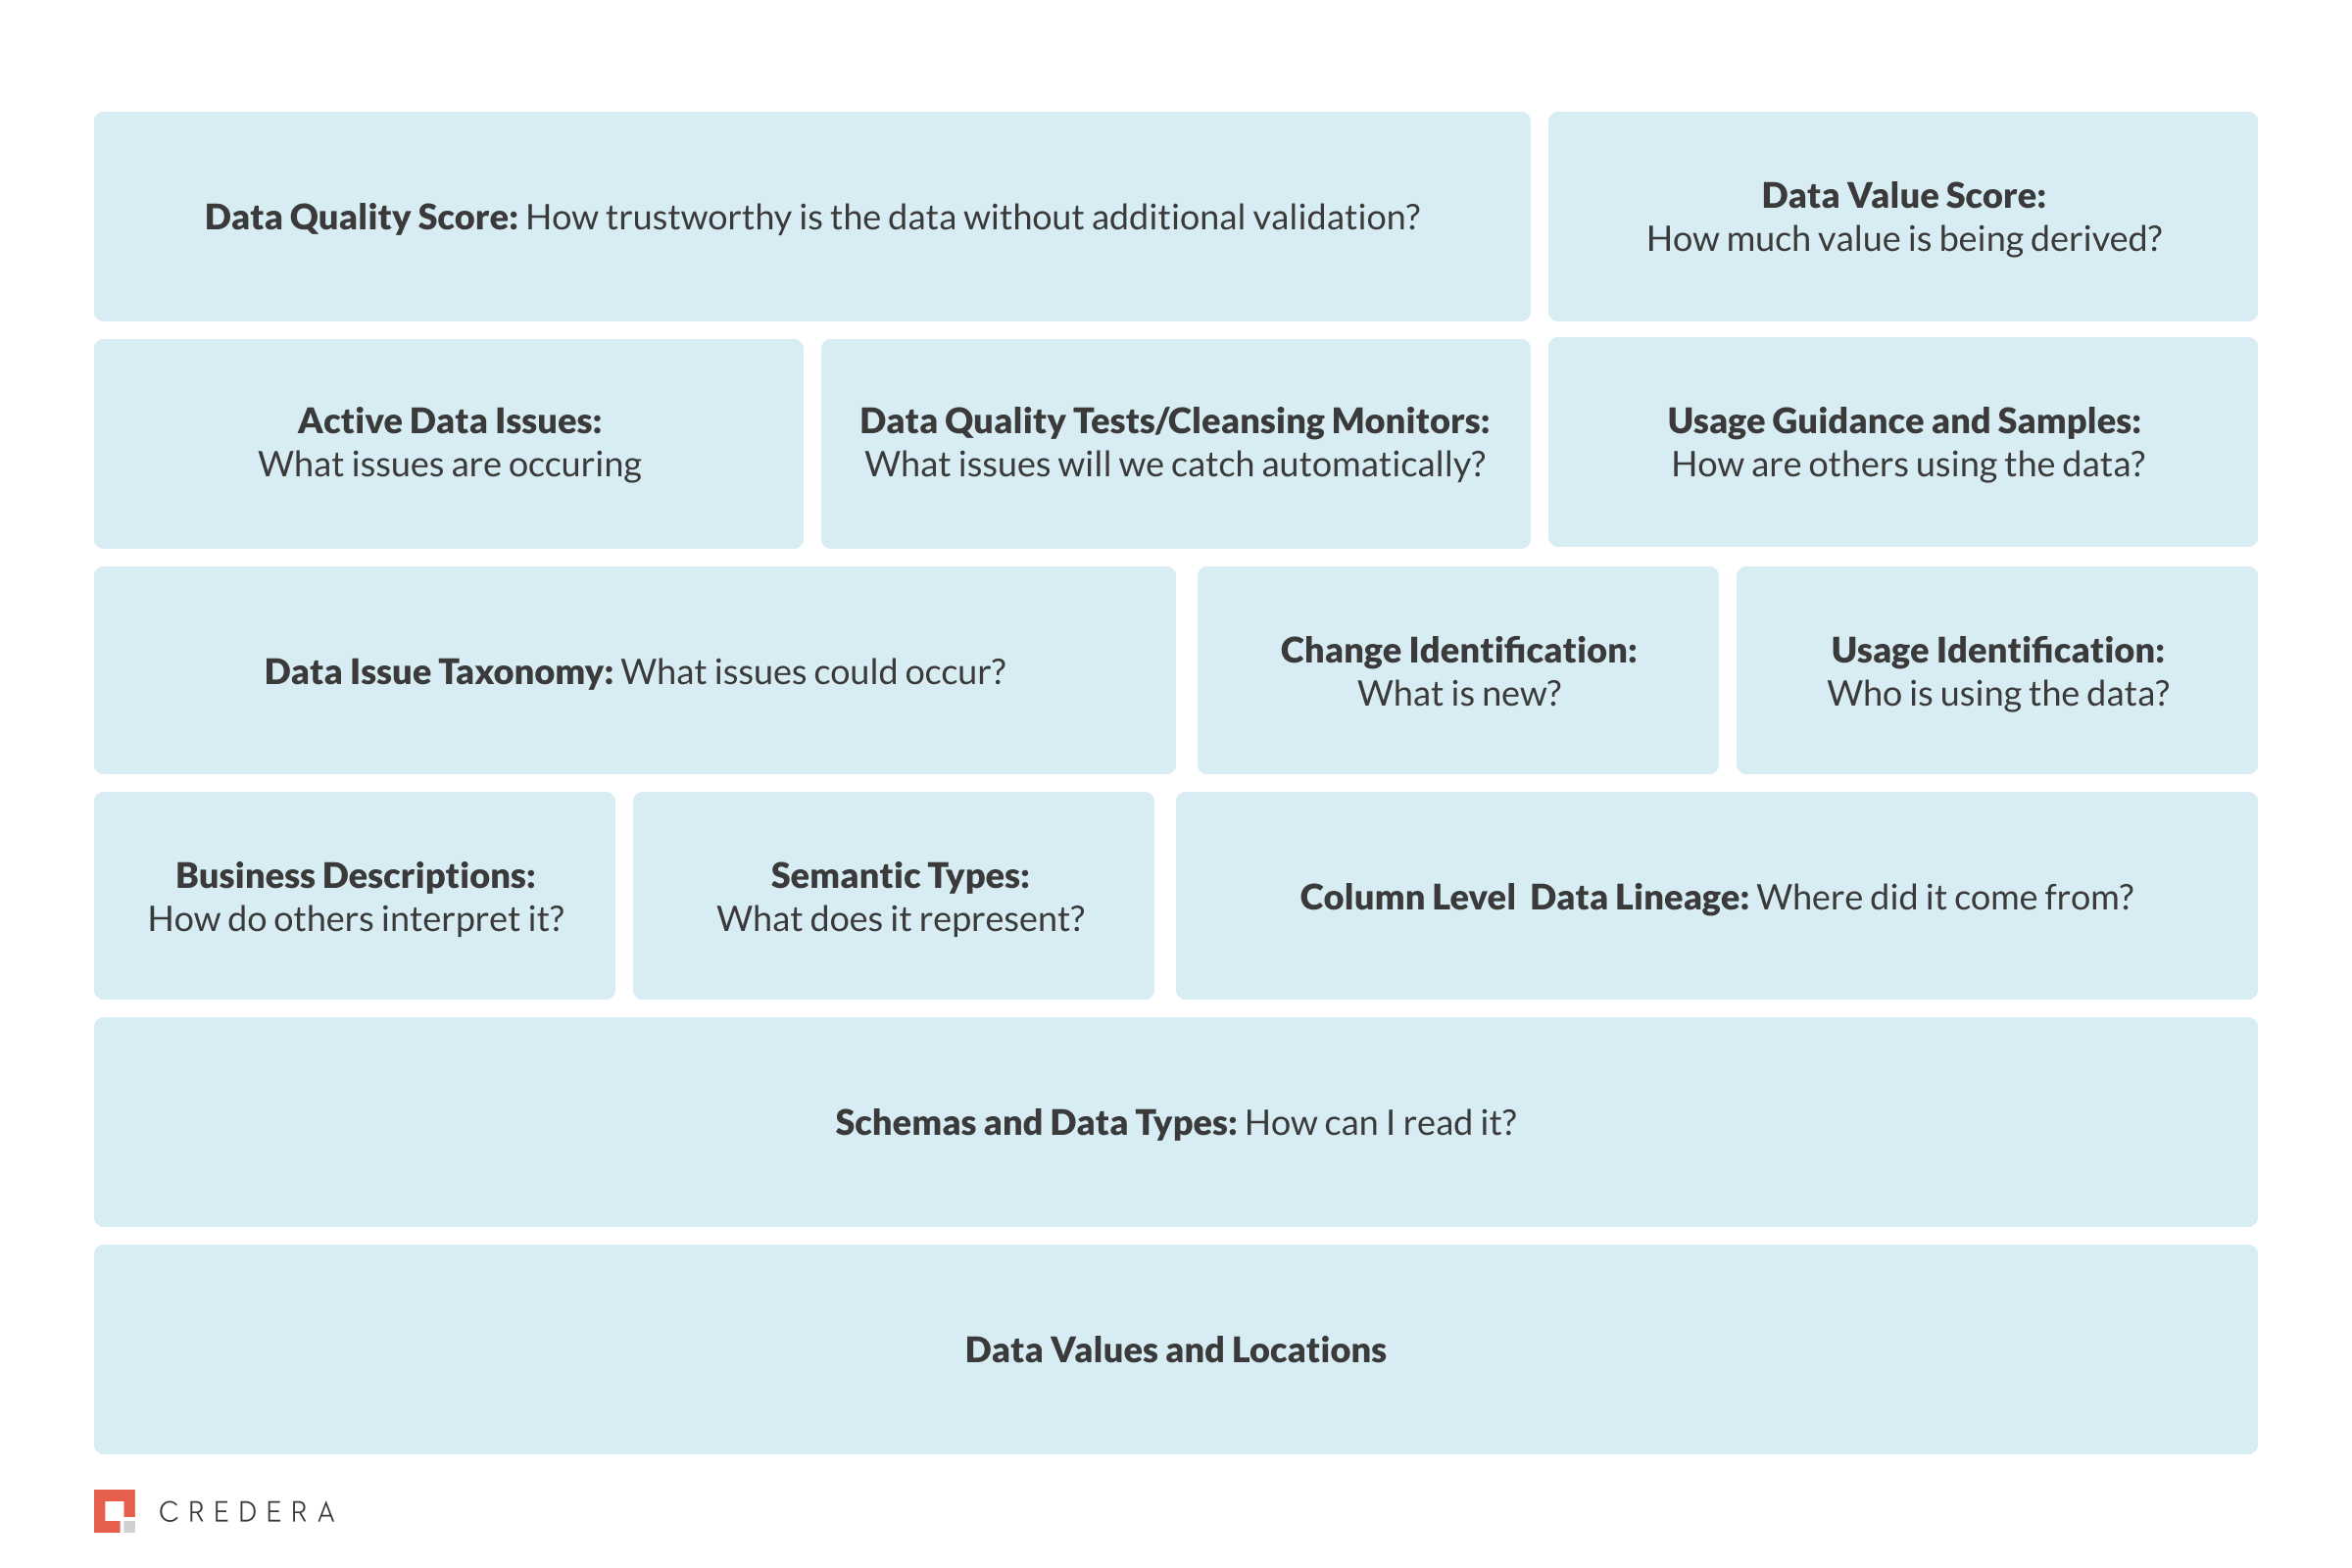
Figure 2: Data Quality Metadata Stack - each layer builds on the foundation below to provide data understanding faster
While data producers should be very focused on the quality of the data products they are building, data consumers are far less concerned with the details. Practically, consumers care to know which data they should trust. This means that your data platform should leverage a layered approach to make data quality information simpler to consume for data consumers:
Data Values - At the first layer, we have the data itself.
Schemas - Next, we make that data readable by providing a schema of data types.
Business Descriptions - When building a data pipeline that provides a critical data element for your organization, adding a description that helps people understand the intent of the field, capturing semantic types (address vs. string or social security number vs. integer), and showing where the field was sourced provide enough of a metadata foundation to facilitate understanding.
Change Logs & Usage – Information about other users of the data and changes that have been introduced by data teams or detected by monitoring further enhance the usage experience.
Data Quality Metadata - Adding the next layer moves the data quality from merely usable to trust-worthy. A foundational data-issue taxonomy enables collective understanding of data quality, from both a prevention (testing/cleansing) and detection (monitoring) perspective. Having a common tool, like Great Expectations, to facilitate harvesting of quality metadata makes the process much easier for data reliability engineers.
Scoring - The combination of the data schema, a business description, expectations, and any known issues detected provides a much more trustworthy data product than simply pointing to a data file. However, when evaluating multiple potential data sources, looking into the details of each one is onerous. Therefore, the final layer in the stack adds summarization techniques that help the data consumer focus in on the highest quality data sources. These data quality and data value scores attempt to provide an easy-to-digest value that can help differentiate between unused, untested data and highly tested, regularly used data, saving data consumers time. However, they also run the risk of over-simplifying the complexity of data quality, so careful user experience research should be undertaken before rolling them out in your organization.
The last step in realizing the value of the data quality stack is visualizing it – moving the display of data quality checks and issues from a centralized data catalog to the end user via their tools of choice. This is dependent on your BI tool choices, and just as with data testing, tool governance helps constrain integration work. A great example of what this can look like is the Tableau Catalog integration, which brings quality warnings directly onto the dashboards.
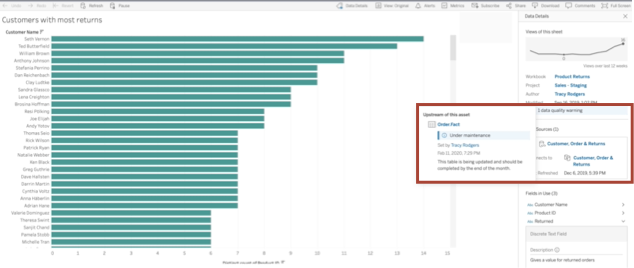
Figure 3: Integrating data quality metrics into your data products directly
A key observation of the steps discussed above is how data quality can be addressed at different points along the typical data pipeline. At one end, it can be addressed by understanding the quality needs of data consumers and involving them in the planning process. At another end, quality can be addressed through improvements to the code base, testing plans, and deployment pipelines. It can then again be addressed several times in between, with each component of your reliability plan building upon the next and providing a layered approach to ensuring the quality of data products.
Credera enjoys leveraging its technology experience to advise organizations on how to unlock the power of their data. If you’d like to have a conversation about getting your organization started with Data Reliability Engineering, please reach out at marketing@credera.com.


Video
Aug 24, 2021
The Credera Brief | Leveraging Data for Successful Marketing
The Credera Brief video series distills trends and ideas from Credera leaders and experts. In this video, Vincent Yates,...
Blog
Feb 3, 2022
Marketing Analytics Platform Powered by OPMG Part 1: Activating Insights From Your...
We're exploring how a single customer view powered by Tealium and AWS can help you provide personalized customer experiences...


Blog
Feb 19, 2021
Realizing Value From Your Data Lake: Lessons Learned and Four Critical Mistakes to...
Data lakes are a great way to organize your company’s data, but a staggering number of data lakes fail to reach their true...


Contact Us
Let's talk!
We're ready to help turn your biggest challenges into your biggest advantages.
Searching for a new career?
View job openings