


Tableau natively supports tooltips for any data visualization. However, what many in the Tableau community consider to be a glaring oversight is the inability to add tooltips to a static textbox. These types of tooltips can be useful to add context when dealing with complex key performance indicators (KPIs), columnar visualizations, or unintuitive filters. For this reason, I will highlight a workaround to add textbox tooltips to your reports in this blog post.
Note: All data used in this blog post uses Tableau’s built-in Superstore dataset.
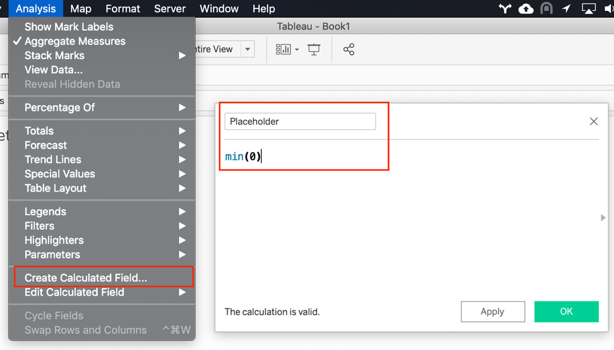
Solution
Create a Placeholder Value
Create a placeholder value in your dataset. The value for this placeholder can be whatever you want. I am partial to using the formula min(0) as it ensures my placeholder value never gets counted or summed, and I don’t have to do any sheet level filtering to prevent duplication.

Add the placeholder value to the visual by dragging it into the Text option of your Marks shelf.
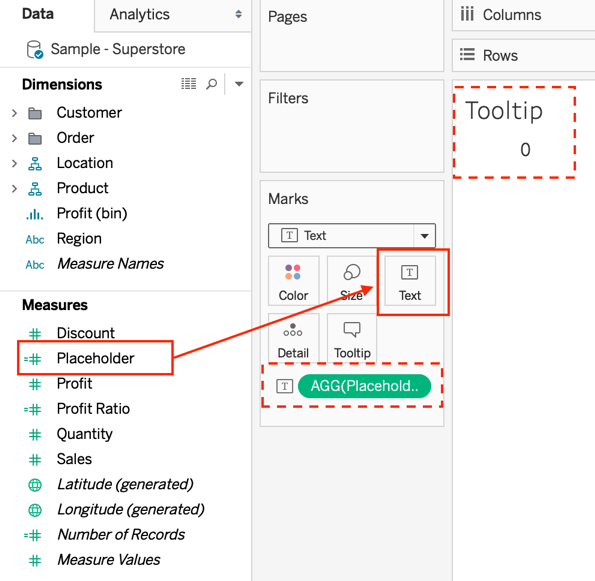
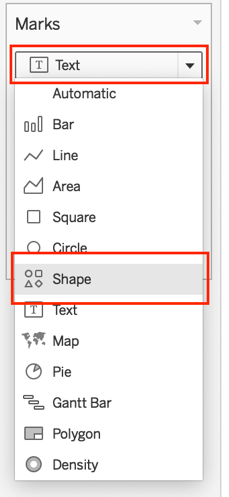
Change the Automatic setting on the Marks shelf to be Shapes.
Note: Tableau will automatically assign a shape to values when you switch to the Shapes setting. We will address this in subsequent steps.
Download a Transparent Image
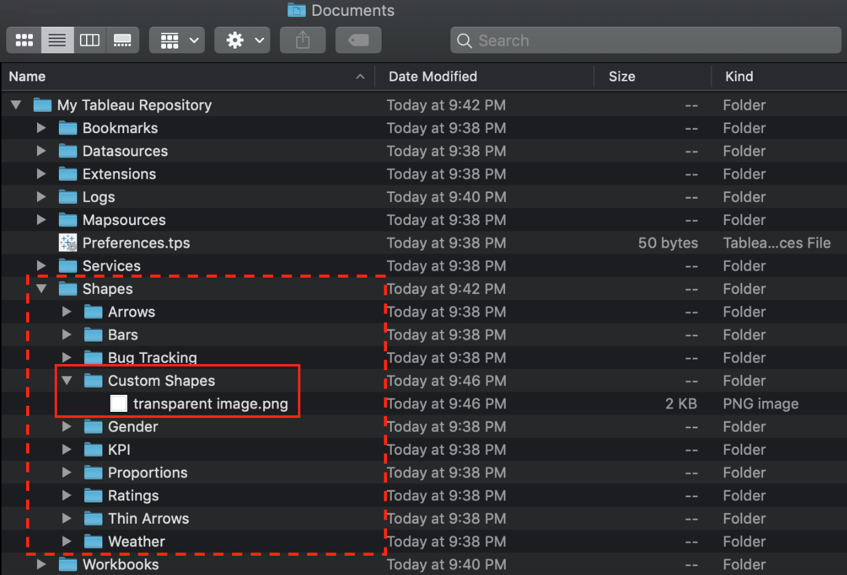
Download a transparent image from the internet and place it in the Shapes folder of your Tableau repository. The default location of this repository for both Mac and Windows is in your Documents folder. Create a new folder inside this repository called Custom Shapes and place the downloaded image in this folder.
Note: The transparent image used in this blog post can be found here.
Create a Transparent Custom Shape
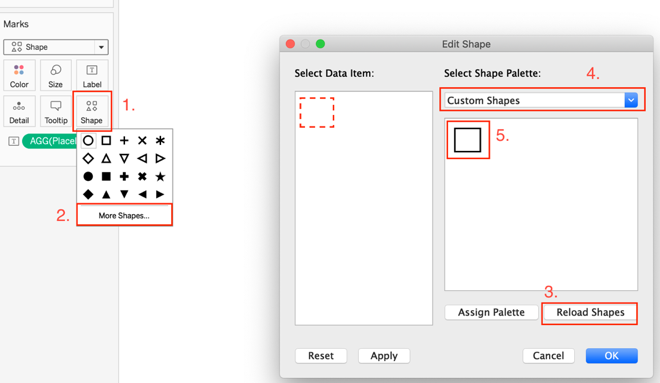
Return to your visual and left-click the Shapes option in the Marks shelf and navigate to More Shapes. This opens up a new dialog box that contains Tableau’s default shapes. Refresh the workbook’s cached Shapes repository by selecting the Reload Shapes option. This reloads the metadata in your report and allows your custom shape to appear. Add the image to the visual by navigating to the Custom Shapes palette and selecting the image.
Note: If you’re using the transparent image in this blog post, you will be unable to see it in your palette since the image is transparent, but if you hover over it, it will be outlined with a black border.
Adjust Placeholder Visualization Format
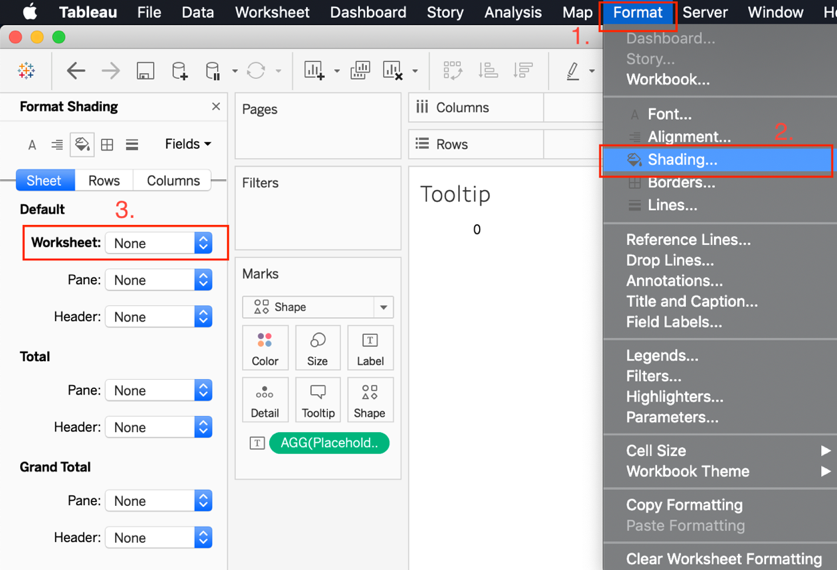
Before adding the tooltip, you’ll need to adjust the formatting on your placeholder visualization. Set the background of the worksheet to be transparent by selecting Format, then Shading…, and setting the Worksheet value to None.
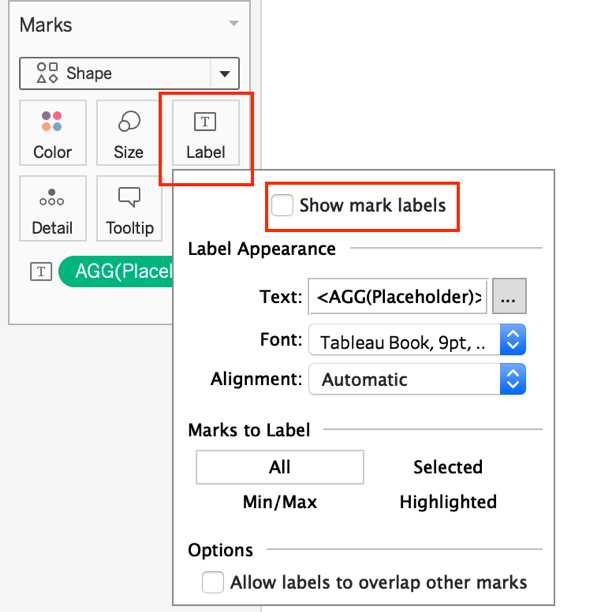
Disable text labels on the worksheet by selecting the Labels option and deselecting the checkbox on Show mark labels. This removes the text that was appearing on the placeholder.
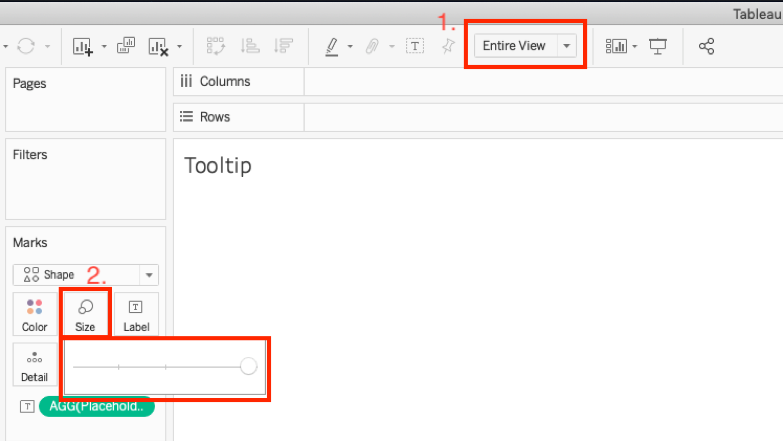
Change the windowing feature from Standard to Entire View. Also, maximize the Size option on the Marks shelf by selecting Size and moving the slider to the far right.
Note: It is crucial that the shape encompasses the entirety of the worksheet as this allows the user to hover over any point of the visual to activate the tooltip.
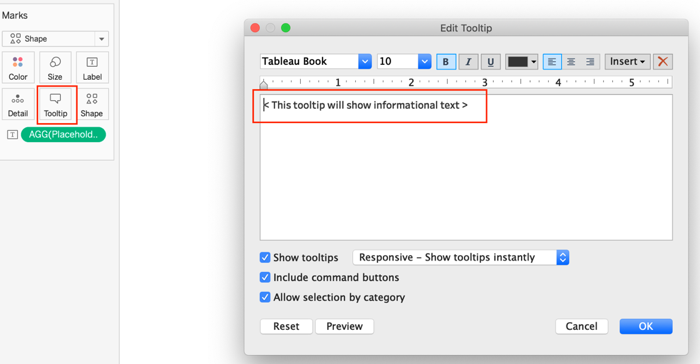
Add the Tooltip
Add your tooltip by selecting the Tooltip option on the Marks shelf.
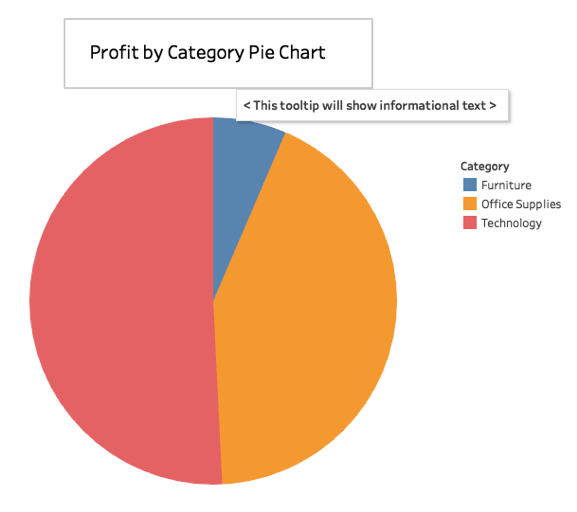
Navigate to the dashboard where you want the tooltip and place the visual that you created in this blog post over the appropriate textbox. You should now have a textbox with a tooltip that appears when you hover over it.
A few additional notes for consideration:
Since the tooltip is actually a visual, it has all the functionality that a visual has. So you can use it for action filters, highlighting, hyperlinking, etc.
A hand will appear when you hover your mouse over the tooltip. This cannot be deactivated.
When publishing this report to your server, make sure to include external files, otherwise the custom shape will not appear.
You aren’t limited to just transparent images; you can use any image as long as it’s a .png or .jpg extension. For instance, we could’ve used a traditional information icon in place of a transparent image.
More Help in Tableau
Feel free to reach out to me at tyler.estes@credera.com with any questions or comments about working in Tableau. Also, please find information about our Analytics & Insights service area on our website. We are always excited to have a conversation around how we can help you tackle your most difficult challenges and enable you to make better data-driven decisions.
Contact Us
Ready to achieve your vision? We're here to help.
We'd love to start a conversation. Fill out the form and we'll connect you with the right person.
Searching for a new career?
View job openings