


The best way to get better at debugging JavaScript with a browser is sticking to a specific browser. The more time you spend with the same tools, the more you will learn about them, instead of re-learning how to do everything over and over again. I use Chrome as my preferred debugging toolset although I have tried to obtain the equivalent features on Firefox and Internet Explorer (IE) 11 in this tutorial. (FYI, the screenshots and shortcuts will be for the Windows versions of browsers.) Let’s get started!
1. Blackboxing
When you “blackbox” a script, you are in essence saying, “I don’t know what goes on in here, and I don’t want to know.” Your browser will not step into a blackboxed script, and it will not pause on exceptions inside that script either. You want to blackbox all the scripts you or your team did not write since you won’t want to debug any libraries you use, especially if they’re minified.
Chrome
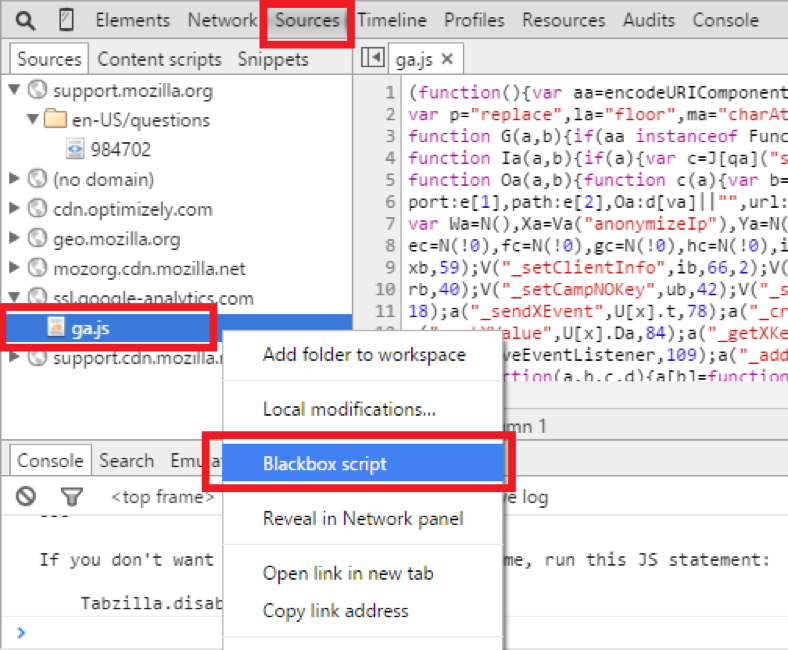
To blackbox a script in Chrome, go to the Sources tab, find the applicable script file on the left-hand pane, and click “Blackbox script.”

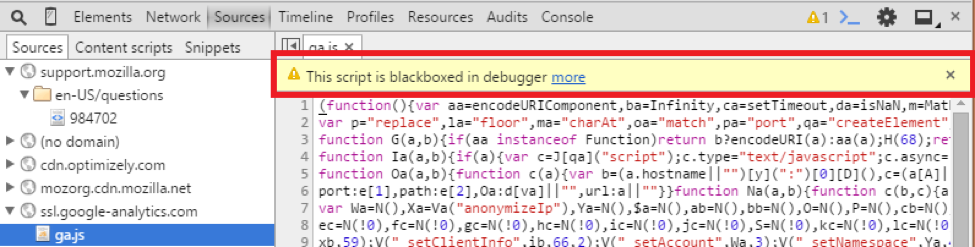
If you open a blackboxed script, a window on the page will notify you.
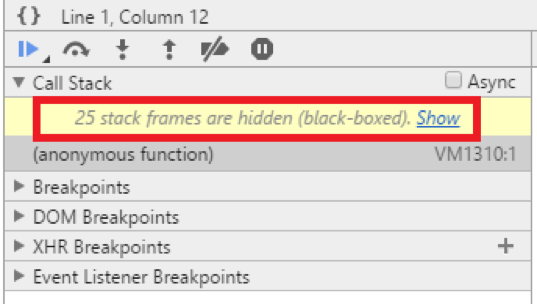
Note: You will not see blackboxed scripts as part of your callstack.
Chrome Developer Tools explains this further.
Firefox
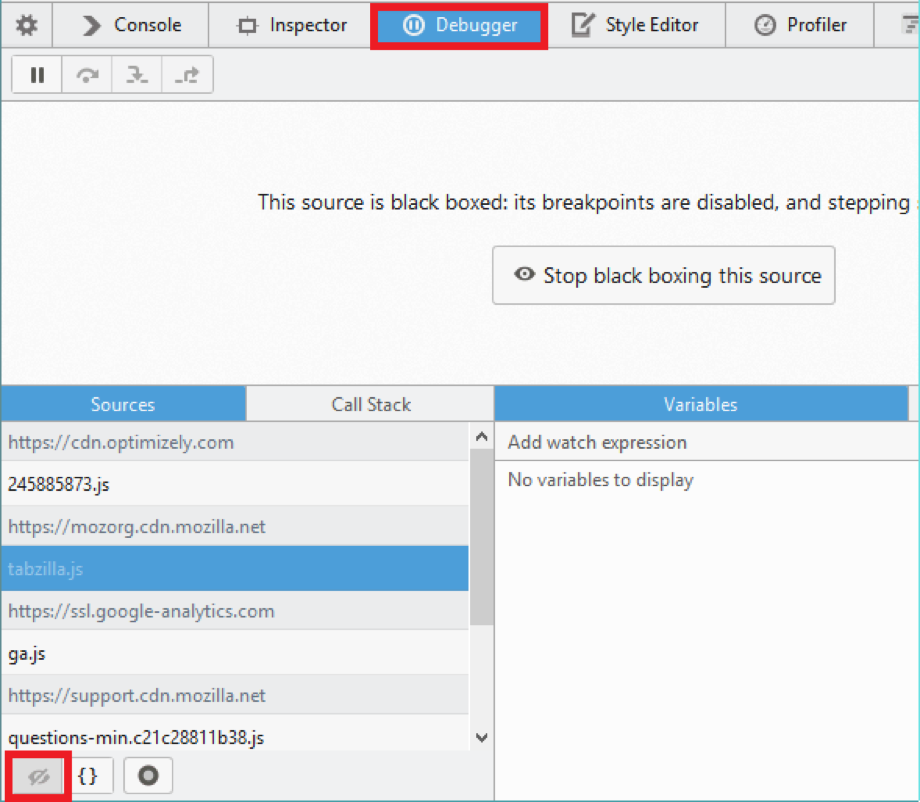
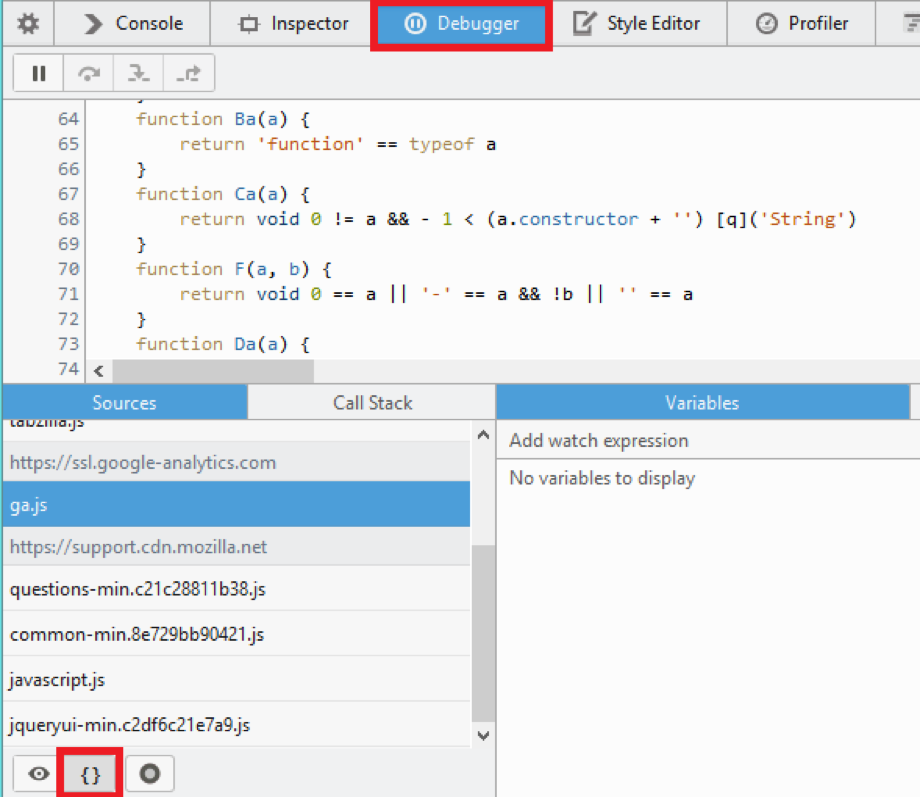
In Firefox you will find this option in the Debugger tab, located in the bottom left-hand corner. The symbol is an eye, and it will be crossed out and gray when enabled. At this time, you will also not see any of the code in that library, unlike in Chrome.
Mozilla Developer Network further explains this process.
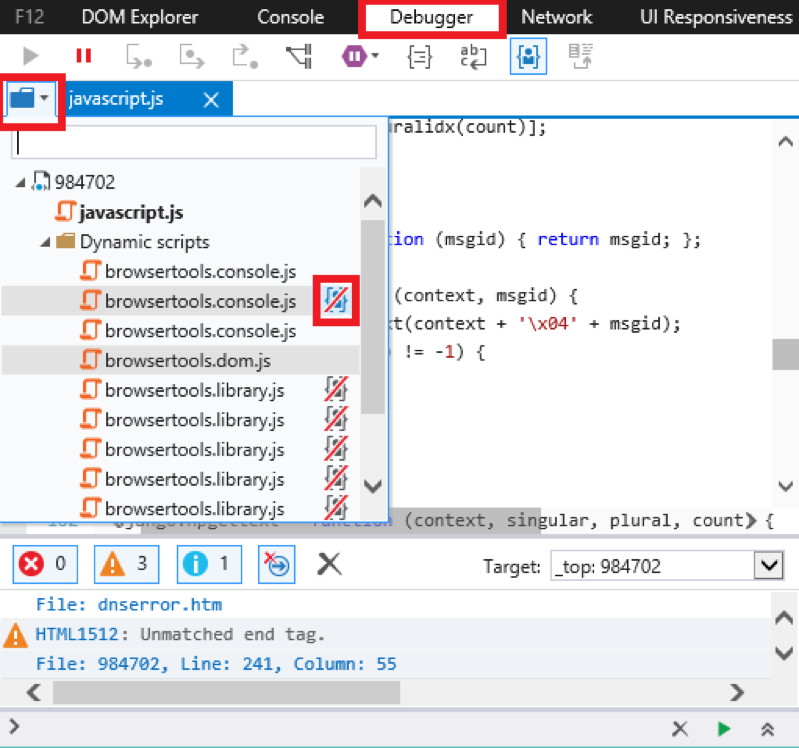
Internet Explorer
In IE you will find this option in the Debugger tab after clicking on the left-hand folder icon to open the script browser. You can either select a script file and click Ctrl+L, or you can click on the icon that shows up to the right of the file. The icon has a slash across it and looks like a user between two curly braces. The user with curly braces is IE’s icon of user-debugging code.
Microsoft gives more details about this on its website.
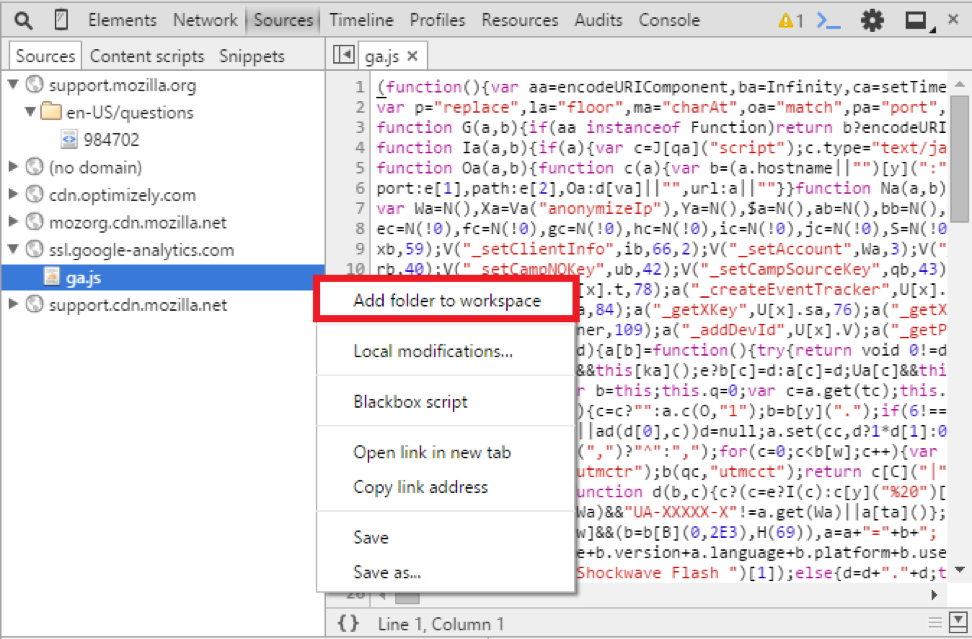
2. Workspaces
This seems to be a feature only in Chrome. It allows you to preserve any edit done in the browser onto your local files when debugging. This can be really useful if you find yourself in a position where you’re using Notepad or some other primitive text-editing tool to view your code and prefer Chrome’s environment. You can find this by going to the Sources tab and right clicking a folder or file. This opens up a browsing window where you can point the browser to where the respective files are on your computer.
You can find more information on Chrome’s website.
3. Disable Cache
Chrome
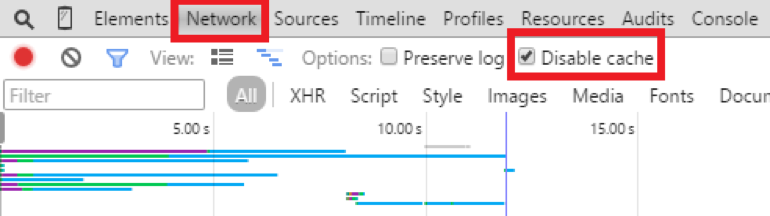
This is an option I always keep on. In theory, it disables caching on your browser but only when DevTools are open, so you can still benefit from caching during normal browsing. In Chrome, it’s located under the Network tab, and it’s a checkbox that says “Disable Cache.”
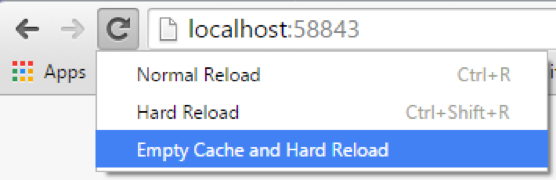
For the pesky times when your files are already cached (because you had DevTools closed), you can get some extra refresh options, but only while DevTools is still open! If you leave your mouse clicked on the refresh icon in Chrome, you can select “Empty Cache and Hard Reload.”
Firefox
Unfortunately, I could not find a similar feature in Firefox (i.e., one that selectively allows you to disable caching). I know you can disable all caching in the options, but that ruins your browser for when you’re not debugging your website.
Internet Explorer
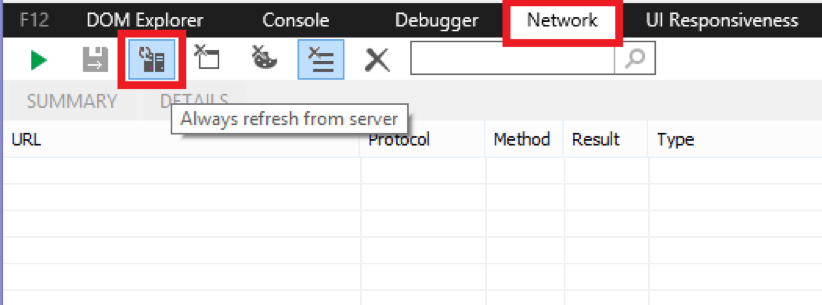
IE has selective disabling of cache as well, located in the Network tab, and it’s a button that looks like two CPU towers with a refresh symbol overlay. The label is, “Always refresh from server.”
4. Console.Table
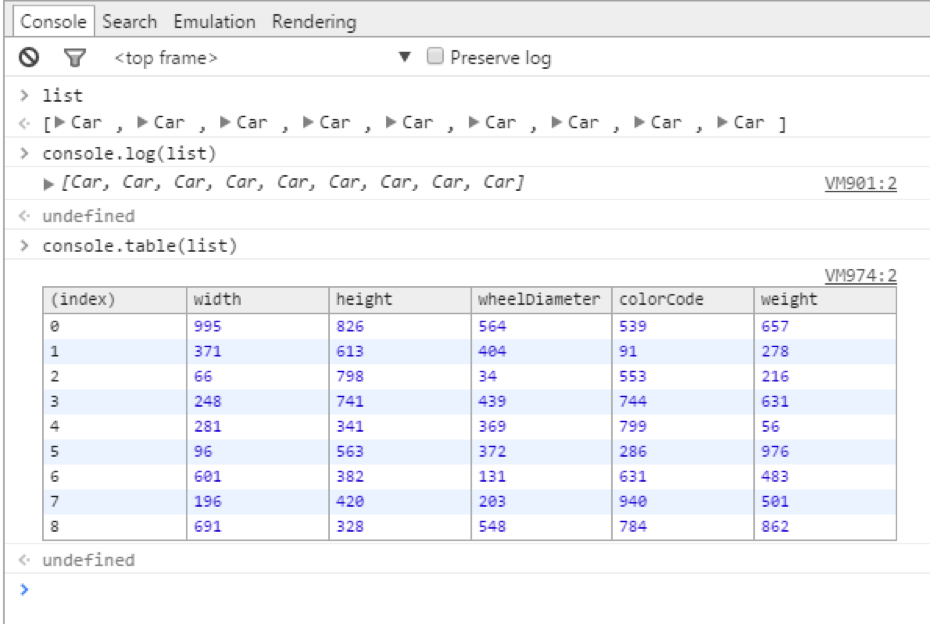
Unless you are just beginning your trek in web development, you have likely heard that using JavaScript alerts to help you identify the contents of your items is a bad idea. You should instead be using the console.log() command to less invasively keep track of objects and where your code is running or failing.
Logging objects works great, until you log a list of items. You now have to open up each item individually. Enter console.table(). This will allow you to preview a list of objects in a quicker fashion. However, it can get a bit hectic if your objects have a lot of properties.
5. Pretty Print
Most of the time you won’t have to debug through minified code, but for those few times you have to jump into production and see what’s going on, minified code can be a killer. Pretty Print allows you to make debugging minified code less painful.
Chrome
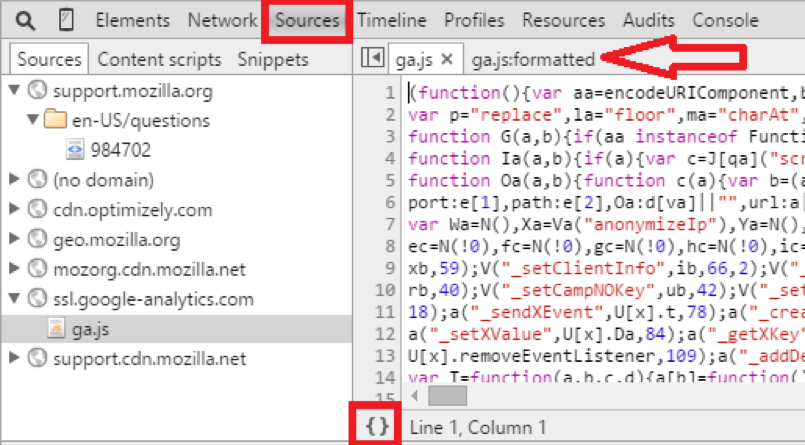
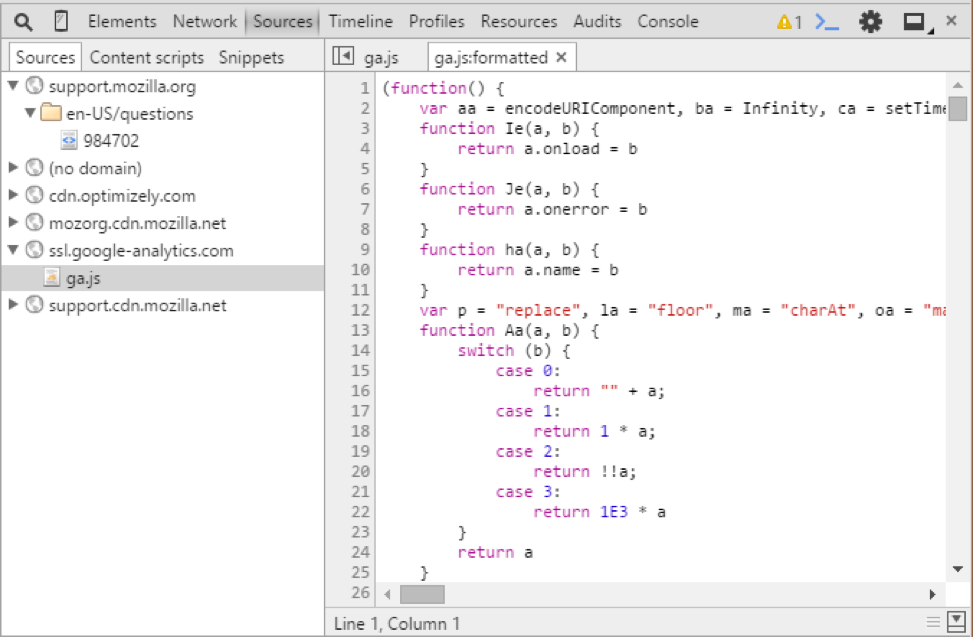
In Chrome the option is called Pretty Print, and it’s a button that looks like two curly braces (located in the bottom left corner of a file you have open). In this case, we’re looking at a minified JavaScript file in the sources tab. Clicking on the button opens up a second tab of the same code, but formatted.
Firefox
In Firefox the option is called, “Prettify Source,” and it shares the same curly braces icon. It can be found in the bottom right hand corner of the Debugger tab.
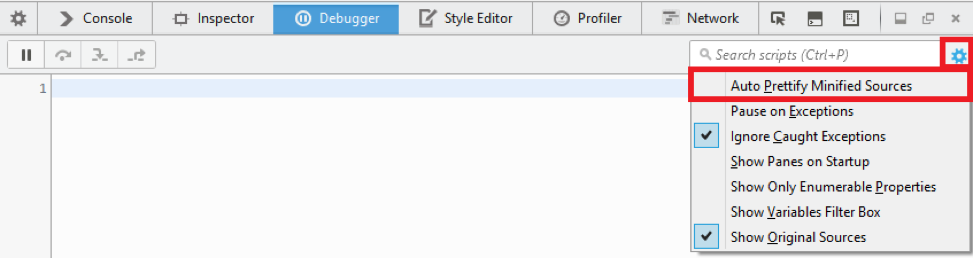
Firefox also has the great option of automatically prettifying minified files. You can set this option by clicking on the settings gear on the right of the developer tools and selecting “Auto Prettify Minified Sources.”
Internet Explorer
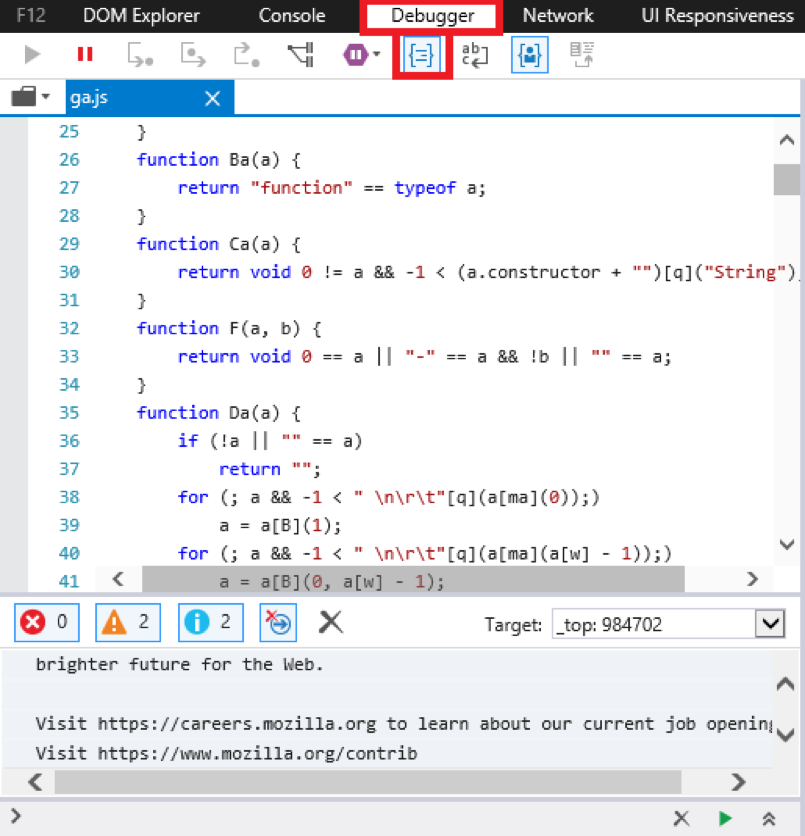
IE also has a similar icon, located in the Debugger tab. The label on the icon when you hover over it is “Turn on pretty print.” It can conveniently be turned on with the Ctrl+Shift+P shortcut.
6. Further Reading: Know Your Shortcuts!
Once you choose which browser you want to use, learn the shortcuts on it that will make your experience better. Don’t just click around the UI to browse for a JavaScript file for which you might not know the location. Use the shortcut to open that file by name. I have added a few of the shortcuts I find myself using often:
Chrome
Find in file: Ctrl+F
Search in files: Ctrl+Shift+F
Open files: Ctrl+O or Ctrl+P
Search for functions: Ctrl+Shift+O or Ctrl+Shift+P
Go to line: Ctrl+G
Chrome’s website has even more shortcuts.
Firefox
Find in file: Ctrl+F
Search in files: Ctrl+Alt+F
Open files: Ctrl+P
Search for functions: Ctrl+D
Go to line: Ctrl+L
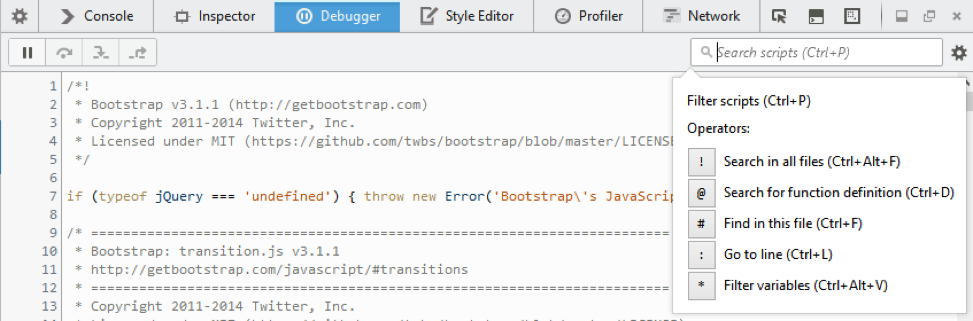
Firefox does an excellent job of revealing a lot of these shortcuts off the bat. Once you click Ctrl+P and your cursor heads over to the search bar, it immediately lets you know other convenient ways of searching.
More shortcuts can be found on Mozilla Developer Network’s website. However, since this page is maintained by the community, it may not always be current. And even those who are updating the site may not catch the mistakes already within it. So take this website with a grain of salt.
Internet Explorer
Find in file: Ctrl+F
Search in files: Ctrl+F (just opens next file)
Open files: Ctrl+O
Search for functions: Unfortunately, IE does not seem to have this function
Go to line: Ctrl+G
More shortcuts can be found on Microsoft’s website.
And that’s all folks! I hope you learned at least one new thing today, and you leave this post a little bit more knowledgeable. Feel free to post your questions and comments below, or find us on Twitter at @CrederaMSFT.
Contact Us
Ready to achieve your vision? We're here to help.
We'd love to start a conversation. Fill out the form and we'll connect you with the right person.
Searching for a new career?
View job openings