


In the introduction to this blog series, I presented a common business problem with Dynamics CRM. A slow performing Dynamics CRM system can be easily improved with some performance tuning and a better understanding of what CRM pages or your custom pages that leverage the CRM SDK are really doing behind the scenes.
So what does New Relic have to do with Dynamics CRM? New Relic is an all-in-one web application performance tool that lets you see performance from the end user experience, through servers, and down to the line of application code or executed SQL statement. It can be extremely useful in helping track down CRM performance issues and is the first step toward understanding what is causing our scenario’s poor performance. In this post, we will set up New Relic to monitor your CRM environment.
INSTALLING NEW RELIC
New Relic provides a free trial, which I will be leveraging for this blog series. Follow the steps in the installer, accepting the defaults and make sure to do an “IISRESET” if you don’t click the checkbox provided on the last page of the setup wizard. Wait about five minutes and you should see your application in New Relic. (Note: you might need to create some traffic in your CRM environment so New Relic has something to report.)
CONFIGURING YOUR CRM APPLICATION IN NEW RELIC
If you log in to New Relic you will notice that your application is called My Application. As of now everything running in IIS is reporting under one application (Note: I will explain how to separate these in the next section). To change this default name open the newrelic.xml file located in C:\ProgramData\New Relic\.NET Agent\newrelic.xml on the server you installed the .Net agent. In this file you should see an <application> node
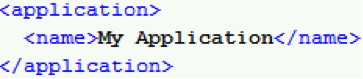

Change the text inside the node to something that is descriptive of your CRM environment, save the .xml, and then perform an “IISRESET.” Wait about five minutes and New Relic will create a new application. When you go back to New Relic you will now see two applications, My Application and the new application name you specified. You can delete My Application since it will no longer be recording information.
CONFIGURING CUSTOM SITES RUNNING ON TOP OF CRM
If you have multiple sites running in IIS you will want to split those into separate applications. Navigate to your custom site’s web.config and add the following

You should change “My Custom App” to something descriptive about that application. Perform another “IISRESET,” and after about five minutes New Relic will pick up the new application and begin reporting it separately (Note: we make CRM the default because we don’t want to change the web.config of our CRM system).
FAMILIARIZING YOURSELF WITH NEW RELIC
To begin seeing the power of New Relic, log in to your New Relic monitoring portal. If you look at Monitoring > Browsers you can see a browser breakdown of your site.
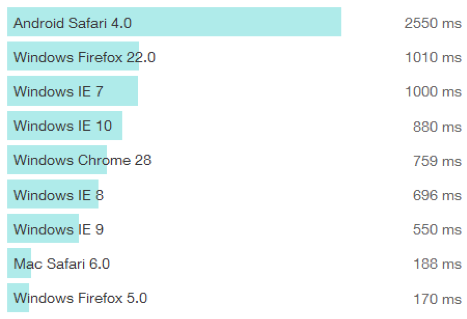
Looking at this picture we can see if any browser has a particularly long load time. This could help to identify browser specific performance issues. If you are using Dynamics CRM 2011 with rollup 12 or higher (support for cross browser compatibility) you can see the wide range of devices hitting your CRM system. As you would expect Android Safari 4.0 (Safari browser running on Android OS) is by far the slowest. This makes sense because it’s a mobile browser being compared to desktop users.
Navigating to Monitoring > Database gives you the ability to look at your queries. From here you can look to see what query has the highest throughput or even the slowest performing queries. This can help track down performance problems without going in and turning on SQL Profiler, which can cause performance issues itself.
Lastly, navigating to Monitoring > Web Transactions is where you can see the overall response time of an individual request. You can look to see what web page in your site is taking the longest to load, and you can even drill down to the individual components of the request.
STAY TUNED
Using these features from New Relic we can really dig into our web site and understand where the load time is coming from. It could be our CRM SDK is performing slowly, it could be network related, or it could even be a third party API that we are calling. In the next post in this series, we will look at these New Relic features in more detail and start identifying some issues with our CRM environment. In the meantime, follow @CrederaMSFT on Twitter to stay up to date with what’s happening in the Microsoft world.
Contact Us
Let's talk!
We're ready to help turn your biggest challenges into your biggest advantages.
Searching for a new career?
View job openings