


March Madness, the college basketball tournament, tips off this week with an estimated $12.1 billion in betting. All of that happens via four primary types of wagers: point spread, moneyline, point total, and prop bets. Chances are, even if you’ve never placed a bet on any of these, you might have heard of the point spreads for the opening round games, which are typically released within hours of the selection committee’s finalized brackets.
But have you ever stopped to think through how analytics might be used to set those lines? Upsets like 2018’s victory of 16th-seed University of Maryland-Baltimore County over first-seed Virginia make it seem daunting to develop a consistently accurate model. With large amounts of money riding on these point spreads, elements like data collection and machine learning are playing an ever-increasing role.
At Credera, it is common for us to help our clients increase their analytic maturity using some of the same data analysis that is used to determine point spreads. In this blog post, I will explore these common data elements and how they are used to set point spreads for March Madness.
Background
Contrary to popular belief, the point spread is not a prediction of the winning team’s margin of victory. Rather it is intended as a big juicy carrot to entice casual sports fans and professional bettors to make a wager on either side of the line. Optimizing the pots on both sides is the real goal of point spreads. It’s all about forcing the bettor to make a decision on how to wager their money.
The process of establishing betting lines includes a considerable amount of data analysis. It starts with collecting as much information as possible about the teams involved, modeling that data to see which variables will most accurately predict the outcome, and adjusting the model based on real-time information. Interestingly, while the point spread is designed to split the pot, it often is very close to the outcome of games as if it resembled the margin of victory.
Types of Data and Data Collection
A single college basketball game can produce hundreds of data points, each of which has its own part to play in explaining why one team won and the other team lost. Typically, that data falls into one of three categories:
Team-specific metrics such as three-pointers taken, three-pointers made, overall shooting percentage, and foul-shooting percentage.
Player-specific metrics such as minutes played, rebounds, turnovers, and plus/minus.
Game-specific data such as neutral site, duration, attendance, and officiating crew.
Data collection often involves finding a site that has the needed data, utilizing an exposed API or web-scraping tool to extract it into usable formats like CSV or JSON files, combining data from different sources, and prepping it for modeling. This process of collecting, combining, and prepping data is not unique to the sports betting industry. Data collection and data integrity are critical for any company that wants to compete in our digital economy, and it’s one of the first things Credera considers when helping our clients better utilize their data.
Data Modeling and Testing for Best Predictors
Once the data has been prepared, the next step is to create a model that will accurately predict game outcomes. This process typically involves machine learning, a subset of artificial intelligence (AI) that creates systems to learn and predict outcomes without manually programming a computer. I won’t go into much detail here on machine learning, but encourage you to read Credera’s perspective on machine learning essentials.
The primary method for evaluating how good a variable is at predicting the outcome is using regression—plotting the independent variable on the x-axis in a scatter plot against the dependent variable. This will produce an r-squared value, which will indicate that variable’s level of predictiveness based on how close it is to 1. For example, Villanova won the 2018 tournament and based on their regular season performance, turnovers per game and three-point shooting percentage are two variables that could be tested:
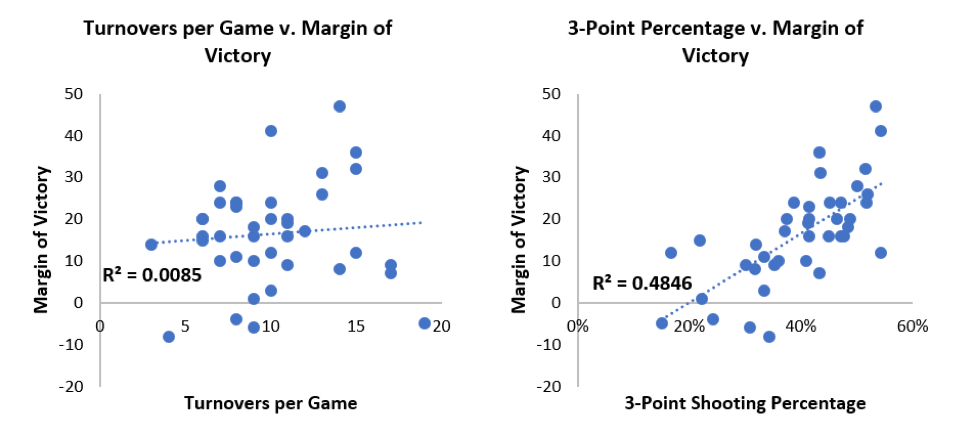
Regression modeling shows that turnovers per game is not a good predictor of the final outcome, whereas three-point shooting percentage is a better predictor. It has a much higher r-squared value (0.4846 as opposed to 0.0085), but it’s still not ideal because of the three data points where Villanova shot above 53%. Villanova won all of these games, but by margins of 47, 41, and 12.
The other part of modeling is figuring out the best way to combine the best predictors. The final model, while it may include three-point shooting percentage, may only give that variable a 10% weighting because others do a better and more consistent job of predicting the outcome. Regression analysis is also used in other industries for tasks like forecasting revenue, predicting future demand, and optimizing business processes.
Optimizing Pots
Once a working model that can predict game outcomes with a high degree of accuracy has been implemented, the last step is to adjust this prediction up or down to best entice fans to bet. As a point of reference, the house collects 10% from the winning pool as a fee for brokering the bet. This means the goal is not to set the most accurate line for a given game, but rather to set a line that will encourage similarly-sized pots on either side. If too much money is landing on the side of the favorite, and the upset covers, that’s a losing proposition for the house. Factors such as how each team in the predicted match-up has fared historically against the spread, any injuries to key players that happen in the lead-up to the tournament, and seed number can impact where the line is set in addition to more subjective measures, such as sports writers’ match-up predictions and social media buzz.
Evaluating Accuracy
So how good are the oddsmakers at setting their lines? Perfect lines would mean 50% of the time the underdog covers the spread and 50% of the time they don’t. Since the 2004 tournament, overall deviation from 50% has fluctuated from a minimum of 0.79% in 2018 to a maximum of 11.82% in 2008. As data analysis tools have matured, the trend has narrowed with local maximums and minimums getting closer to 0 from 2008 to 2018, indicating that line-setting accuracy has improved over the past 10 years. The year-over-year fluctuation as seen below may point to some level of overcorrecting in an effort to get as close as possible to 0%:
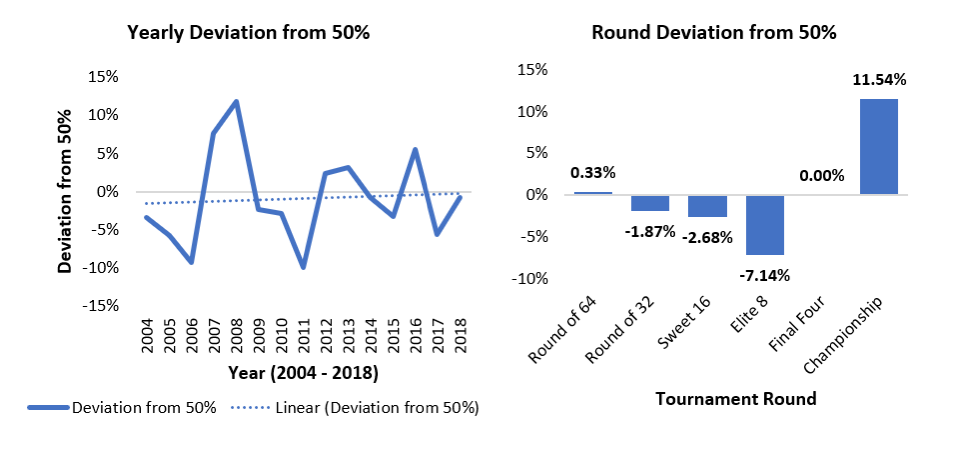
Additionally, looking at the deviation from a perfect 50% by round of the tournament highlights the high degree of accuracy in the Round of 64 and the Final Four. With the exception of the Final Four, accuracy improves from the early rounds to the late rounds, which intuitively makes sense because there are more games played and therefore more data points in the early rounds.
Keep in mind point spread betting is binary; either the favorite covers the spread or they don’t, and it doesn’t matter by how much. In 1985 Villanova was an eight-point underdog against Georgetown in the championship game and won by two, but in 2010 Butler was a seven-point underdog to Duke and lost by two. Both underdogs covered the spread. While the high-profile upsets are what tend to stand out during March Madness, the accuracy of point spreads ensures the real winners year over year are the Vegas oddsmakers.
Applying Analytics
I hope this post has helped you gain a high-level understanding of applying analytics to March Madness and how analytics can be used in other industries. If you have questions about data collection, or you’re looking to develop more data-driven strategies, Credera can help—reach out to us at findoutmore@credera.com.

Data
Apr 29, 2020
Apply AI & ML to Your Predictive Next Best Actions and Meet Your Customers Where They Are
Leveraging predictive and prescriptive analytics that treat each of your customers as unique individuals means advancing them...

Data
Apr 20, 2020
Data Integrity Series: Three Key Factors to Incorporate Into Your Data Quality Approach
How are we still talking about data quality? For 15 years, every client I’ve engaged with has been limited in some way by the...

Technology
Oct 08, 2020
Credera’s MarTech Reference Architecture Part 7: Advanced Analytics & Marketing Measurement
In our final article of the series, we'll discuss how to use advanced analytics to effectively measure success and ensure ong...


Contact Us
Ready to achieve your vision? We're here to help.
We'd love to start a conversation. Fill out the form and we'll connect you with the right person.
Searching for a new career?
View job openings